

Is It Too Late To Consider United Airlines After Its Strong Multi Year Share Price Rally
- Wondering if United Airlines Holdings is still good value after its big run, or if most of the upside has already been priced in? You are not alone. That is exactly what this piece will unpack.
- United's share price has climbed 3.3% over the last week, 7.3% over the past month, and is up 9.5% year to date, adding to a hefty 136.2% gain over three years and 123.7% over five years that has reshaped how investors see its risk and reward profile.
- Those moves have come as investors react to a mix of macro and industry drivers, including ongoing travel demand strength, shifting interest rate expectations, and changing sentiment toward economically sensitive stocks. In addition, operational and balance sheet developments, along with evolving views on long term air travel trends, have all fed into how the market currently prices United.
- Even after this rally, United scores a 4 out of 6 on our valuation checks, suggesting pockets of undervaluation that are not obvious from the share price alone. Next we will break down how different valuation approaches view the stock today, and then, at the end of the article, look at a more powerful way to bring those methods together into a single, clearer view of value.
Approach 1: United Airlines Holdings Discounted Cash Flow (DCF) Analysis
A Discounted Cash Flow model estimates what a business is worth today by projecting its future cash flows and discounting them back to the present. For United Airlines Holdings, this is done using a 2 Stage Free Cash Flow to Equity approach based on cash flow projections.
United generated trailing twelve month free cash flow of about $2.6 billion, with analysts and internal estimates pointing to growth toward roughly $7.3 billion in free cash flow by 2035. Analyst forecasts cover the next few years. Beyond that, Simply Wall St extrapolates growth, tapering from faster gains in the near term to more moderate increases further out.
Based on these cash flows, the DCF model arrives at an intrinsic value of about $207.18 per share, implying the stock is trading at roughly a 49.6% discount to estimated fair value. This indicates that the current price may not fully reflect the cash United is expected to generate over the coming decade.
Result: UNDERVALUED
Our Discounted Cash Flow (DCF) analysis suggests United Airlines Holdings is undervalued by 49.6%. Track this in your watchlist or portfolio, or discover 906 more undervalued stocks based on cash flows.
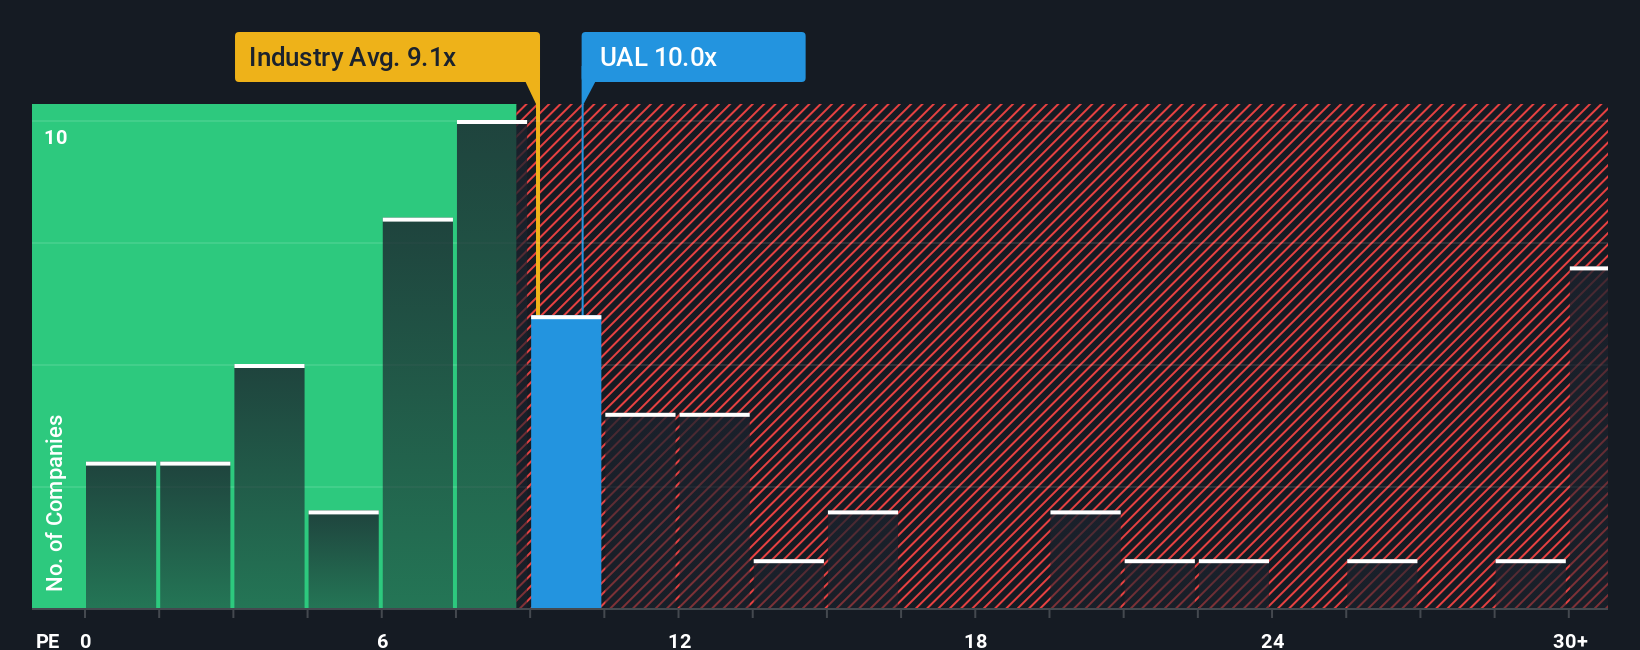
Approach 2: United Airlines Holdings Price vs Earnings
For a profitable company like United Airlines Holdings, the price to earnings, or PE, ratio is a straightforward way to see how much investors are paying for each dollar of current profit. The higher the expected earnings growth and the lower the perceived risk, the higher a normal or fair PE ratio tends to be, and vice versa when growth is modest or risks are elevated.
United currently trades at about 10.27x earnings, slightly above the Airlines industry average of roughly 9.25x, but well below the broader peer group average of around 28.88x. To move beyond simple comparisons, Simply Wall St uses a proprietary Fair Ratio, which for United is estimated at about 14.73x. This metric reflects what PE might be reasonable given the company’s earnings growth outlook, profitability, risk profile, industry, and market cap.
Because the Fair Ratio incorporates these fundamentals, it offers a more tailored benchmark than raw industry or peer averages. With United’s actual PE of 10.27x sitting notably below the Fair Ratio of 14.73x, the multiple based view suggests the market is still discounting the stock relative to its fundamentals.
Result: UNDERVALUED
PE ratios tell one story, but what if the real opportunity lies elsewhere? Discover 1450 companies where insiders are betting big on explosive growth.
Upgrade Your Decision Making: Choose your United Airlines Holdings Narrative
Earlier we mentioned that there is an even better way to understand valuation, so let us introduce you to Narratives, a simple framework where you write the story behind your numbers by linking your view of United’s future revenue, earnings, and margins to a financial forecast and then to a fair value, all inside an easy to use tool on Simply Wall St’s Community page that millions of investors already access. A Narrative lets you spell out why you think, for example, that resilient premium demand and margin expansion justify a higher fair value than today’s price, or alternatively, that leverage, competition, and regulatory risks support a much lower fair value. It then continuously compares that Fair Value to the live market price so you can see when your buy or sell thresholds are triggered. Because Narratives automatically refresh when new data comes in, such as updated analyst targets that now cluster around $122.90 per share or bearish views nearer $43.00 per share, they help you quickly test whether your story about United Airlines Holdings still holds up or needs to change.
Do you think there's more to the story for United Airlines Holdings? Head over to our Community to see what others are saying!
This article by Simply Wall St is general in nature. We provide commentary based on historical data and analyst forecasts only using an unbiased methodology and our articles are not intended to be financial advice. It does not constitute a recommendation to buy or sell any stock, and does not take account of your objectives, or your financial situation. We aim to bring you long-term focused analysis driven by fundamental data. Note that our analysis may not factor in the latest price-sensitive company announcements or qualitative material. Simply Wall St has no position in any stocks mentioned.
Have feedback on this article? Concerned about the content? Get in touch with us directly. Alternatively, email editorial-team@simplywallst.com