

Is It Too Late To Consider GE Vernova After Its 84% Surge In 2025?
- If you are wondering whether GE Vernova’s huge run up has already priced in the upside, or if there is still value on the table, you are not alone.
- The stock has climbed 3.9% over the last week and 8.7% in the past month, and is now up an eye catching 84.5% year to date and 91.4% over the last year. This naturally raises questions about how much future growth is already baked in.
- That surge has been fueled by growing investor enthusiasm around the company’s role in the global energy transition, including its expanding grid, wind, and gas power businesses. Policy support for renewables and grid modernization, along with increased attention on decarbonization infrastructure, has helped shift the narrative toward GE Vernova as a potential long term structural winner rather than a niche industrial play.
- Despite that optimism, GE Vernova currently scores just 0/6 on our valuation checks, suggesting the market may be paying up aggressively. Next we will break down what different valuation approaches say about the stock, and finish by exploring a more holistic way to judge whether the current price truly makes sense.
GE Vernova scores just 0/6 on our valuation checks. See what other red flags we found in the full valuation breakdown.
Approach 1: GE Vernova Discounted Cash Flow (DCF) Analysis
A Discounted Cash Flow model estimates what a company is worth today by projecting its future cash flows and then discounting those back into present dollars. For GE Vernova, the model starts with last twelve month Free Cash Flow of about $2.5 billion and builds up a picture of how that cash generation could grow over time.
Analysts provide explicit forecasts for the next few years, with Simply Wall St extrapolating further out to 2035. Under this 2 stage Free Cash Flow to Equity approach, projected Free Cash Flow climbs to roughly $13.8 billion by 2035, reflecting strong expected expansion in the power and grid businesses before growth gradually tapers.
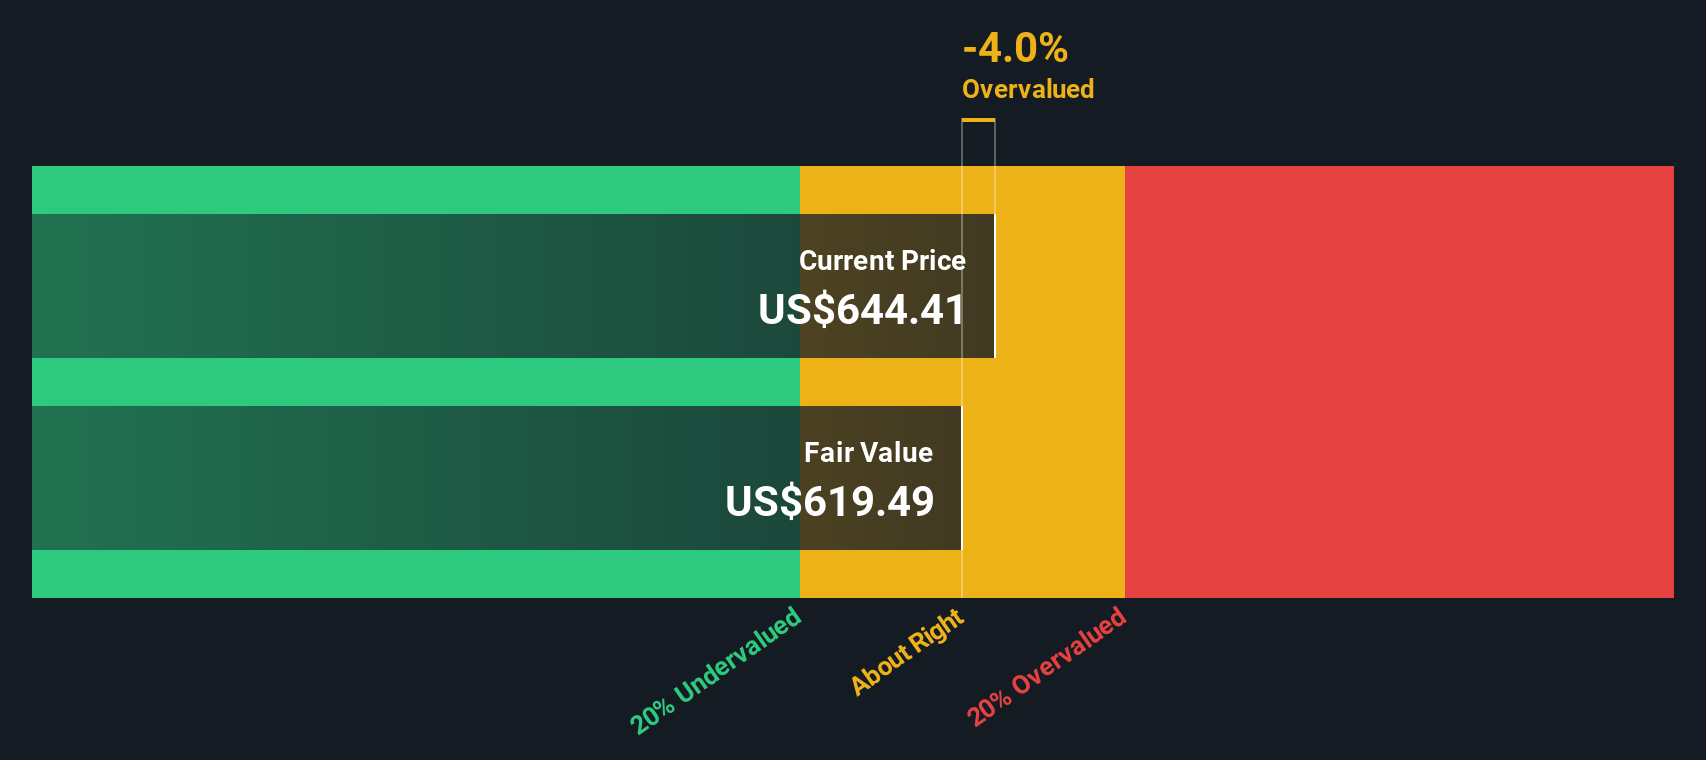
Bringing all those projected cash flows back to today yields an estimated intrinsic value of about $577 per share. Compared with the current share price, the DCF implies GE Vernova is roughly 8.4% overvalued. This suggests the recent rally may have pulled the stock slightly ahead of its underlying cash flow fundamentals.
Result: ABOUT RIGHT
GE Vernova is fairly valued according to our Discounted Cash Flow (DCF), but this can change at a moment's notice. Track the value in your watchlist or portfolio and be alerted on when to act.
Approach 2: GE Vernova Price vs Earnings
For profitable companies like GE Vernova, the Price to Earnings (PE) ratio is a useful way to gauge how much investors are willing to pay today for each dollar of current earnings. A higher PE can be justified when a business has strong growth prospects and relatively low risk, while slower growth or higher uncertainty usually calls for a lower, more conservative PE multiple.
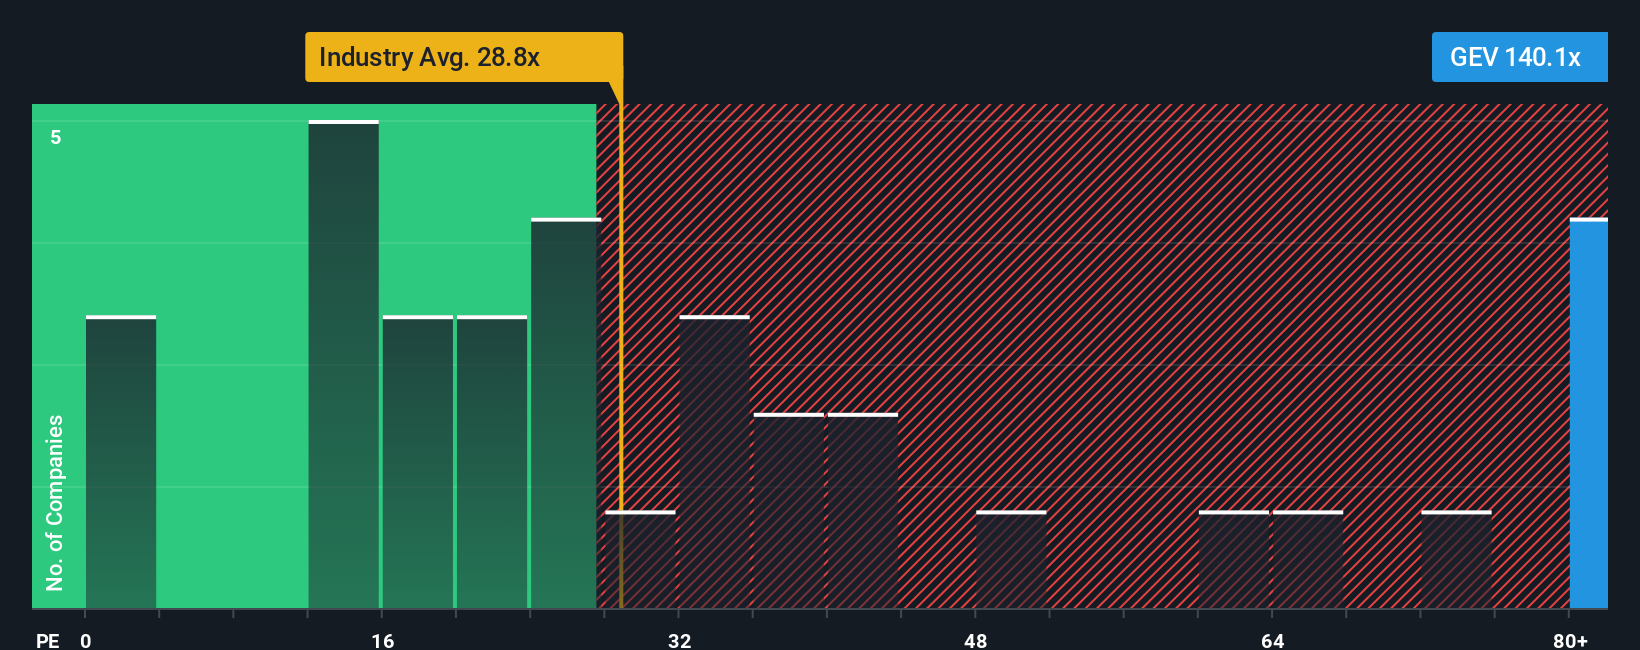
GE Vernova currently trades on a PE of about 99.6x, which is well above both the Electrical industry average of roughly 31.2x and the broader peer group around 28.5x. To move beyond simple peer comparisons, Simply Wall St calculates a proprietary Fair Ratio for each company. This Fair Ratio estimates what PE multiple a stock should reasonably command after factoring in its earnings growth outlook, risk profile, profit margins, industry dynamics and market cap.
For GE Vernova, the Fair Ratio is 74.3x, which is meaningfully below the current 99.6x. That gap suggests the share price is running ahead of what would typically be warranted by the fundamentals, even after allowing for the company’s attractive growth story.
Result: OVERVALUED
PE ratios tell one story, but what if the real opportunity lies elsewhere? Discover 1450 companies where insiders are betting big on explosive growth.
Upgrade Your Decision Making: Choose your GE Vernova Narrative
Earlier we mentioned that there is an even better way to understand valuation, so let us introduce you to Narratives, which are simple stories that investors create to explain how they think a company’s business will evolve, how that translates into future revenue, earnings and margins, and ultimately what a fair value could be.
On Simply Wall St’s Community page, used by millions of investors, a Narrative lets you connect the dots from your view of GE Vernova’s role in electrification and decarbonization, to a concrete financial forecast, and then to a fair value that you can compare directly with today’s share price to decide whether to buy, hold, or sell.
Because Narratives are dynamically updated as new information comes in, like the Taiwan repower deal or recent share repurchases, they stay in sync with reality and make it easy to see how changes in expected growth, margins or risk impact your estimate of fair value.
For example, one GE Vernova Narrative on Simply Wall St might assume strong grid and software momentum and arrive at a fair value near $760, while a more cautious Narrative focused on wind and project risks might see closer to $280, and comparing these perspectives helps you decide which story you believe and how you want to position your own portfolio.
Do you think there's more to the story for GE Vernova? Head over to our Community to see what others are saying!
This article by Simply Wall St is general in nature. We provide commentary based on historical data and analyst forecasts only using an unbiased methodology and our articles are not intended to be financial advice. It does not constitute a recommendation to buy or sell any stock, and does not take account of your objectives, or your financial situation. We aim to bring you long-term focused analysis driven by fundamental data. Note that our analysis may not factor in the latest price-sensitive company announcements or qualitative material. Simply Wall St has no position in any stocks mentioned.
Have feedback on this article? Concerned about the content? Get in touch with us directly. Alternatively, email editorial-team@simplywallst.com