

Is Li Auto Now an Opportunity After Recent Share Price Weakness?
- If you are wondering whether Li Auto is a bargain or a value trap right now, you are not alone. This stock has been on many watchlists lately.
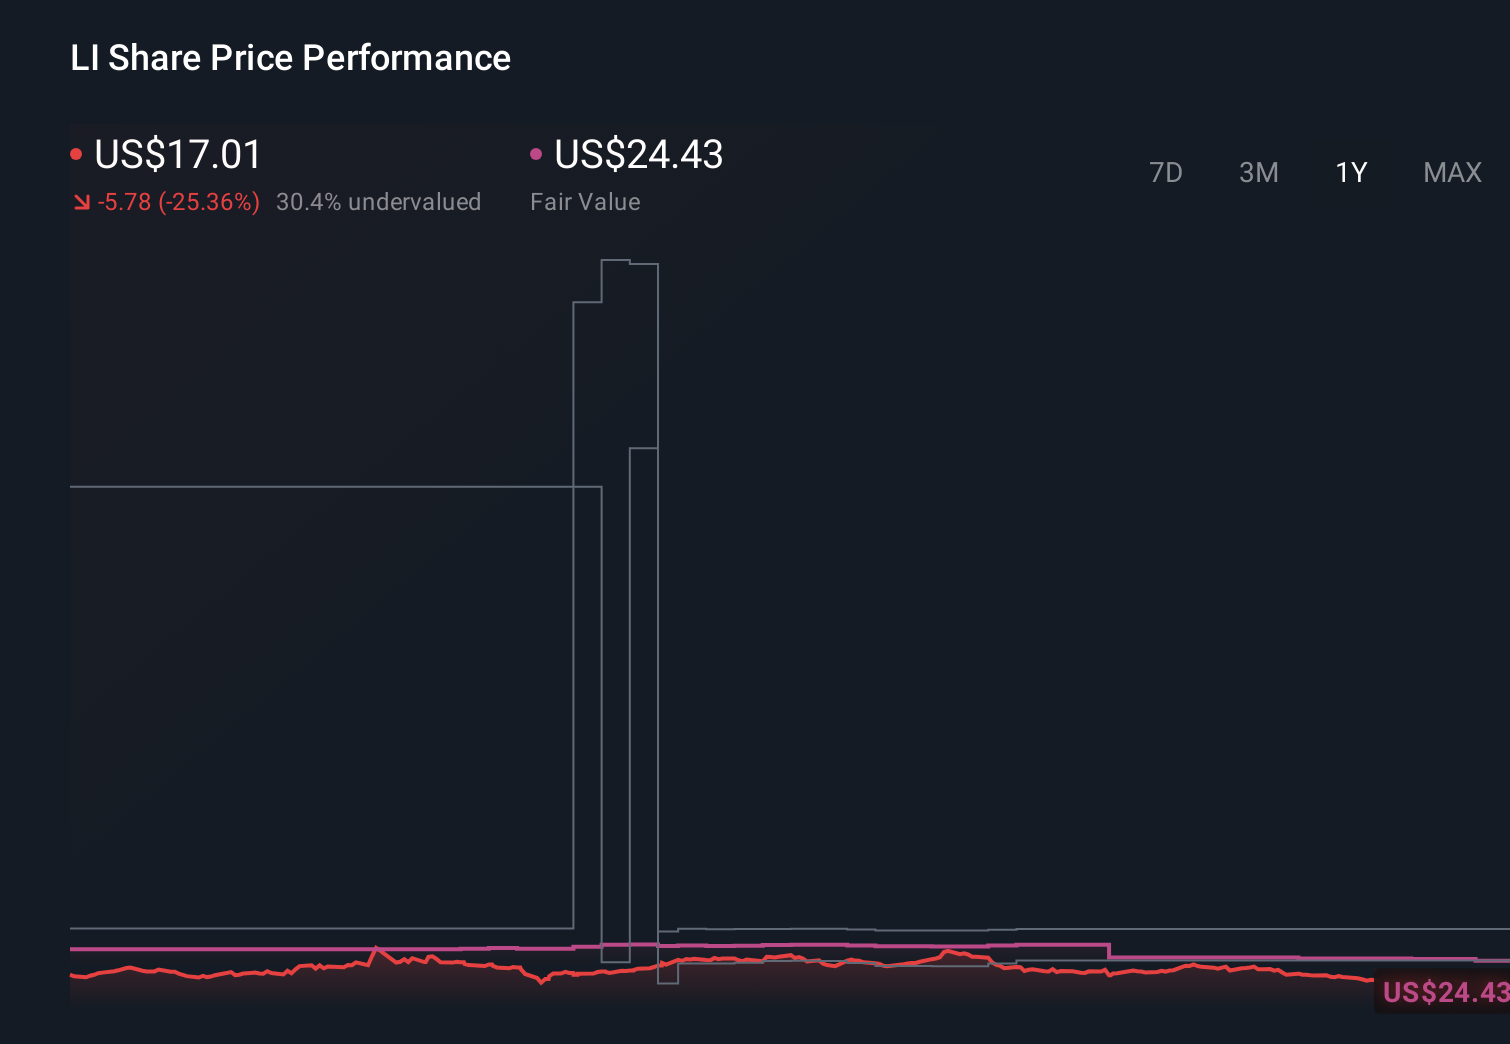
- Despite all the buzz, the share price has been under pressure, slipping 0.3% over the last week and 13.8% over the past month. It is still down 27.6% year to date and 23.8% over the last year.
- Recent headlines around China’s evolving EV incentives, intensifying price competition among local EV makers, and ongoing geopolitical trade tensions have all contributed to shifting sentiment toward Li Auto. At the same time, the company’s continued roll out of new extended range and battery electric models has kept it firmly in the conversation as one of China’s key homegrown EV players.
- On our framework, Li Auto scores a 3/6 valuation check, suggesting it screens as undervalued on half of the metrics we look at. In the next sections, we will examine those different valuation approaches and, at the end, explore an additional way to think about what the market might be pricing in.
Find out why Li Auto's -23.8% return over the last year is lagging behind its peers.
Approach 1: Li Auto Discounted Cash Flow (DCF) Analysis
A Discounted Cash Flow model estimates what a company is worth by projecting the cash it could generate in the future and discounting those cash flows back to today. For Li Auto, this two-stage Free Cash Flow to Equity model starts from its latest twelve month free cash outflow of roughly CN¥9.5 billion and then uses analyst forecasts for the next few years before extrapolating longer term trends.
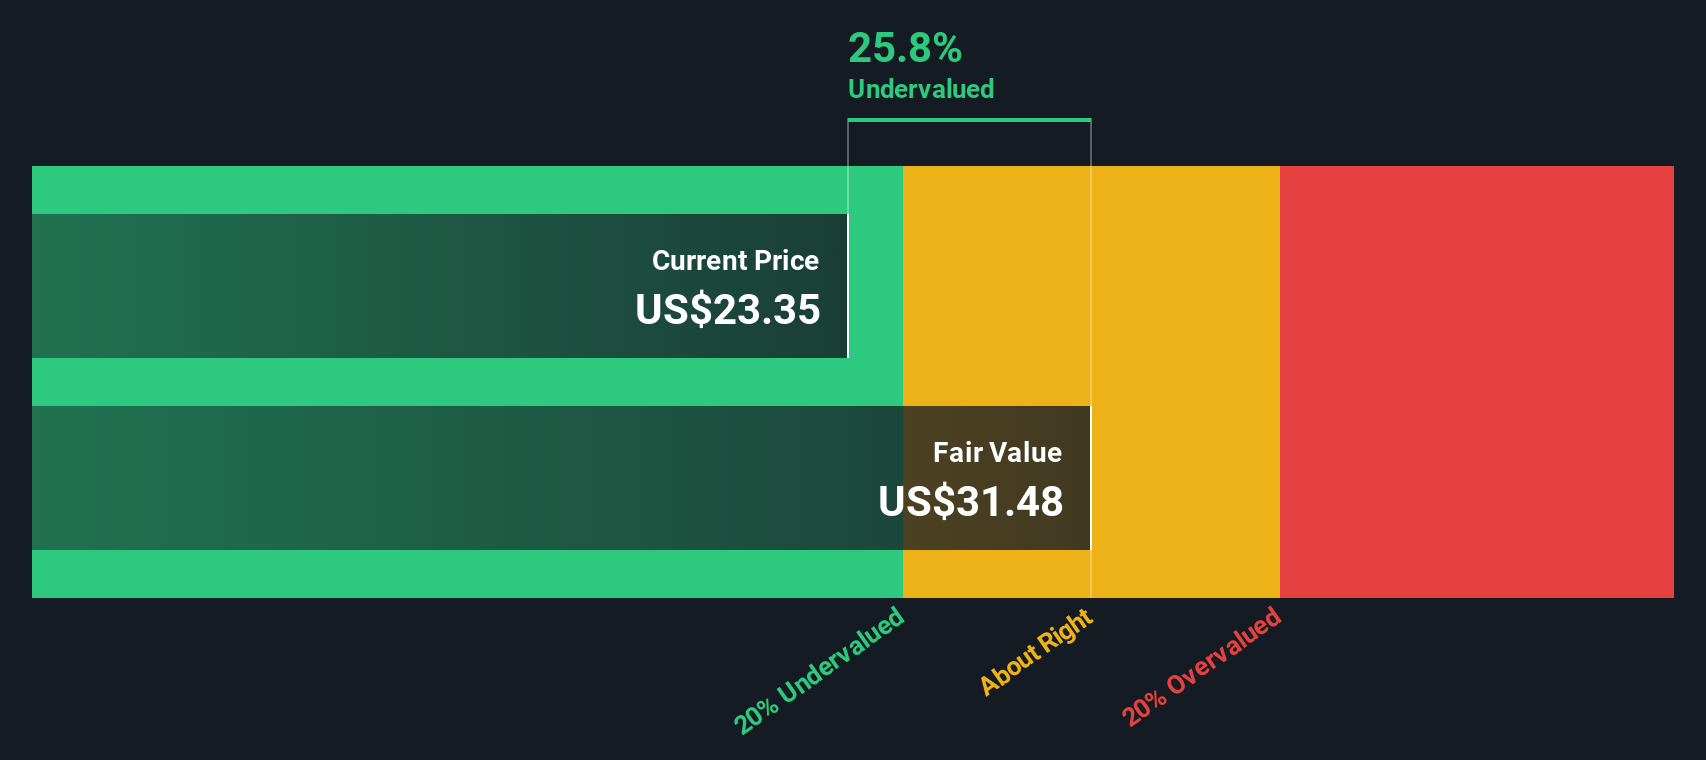
Analysts and model estimates see Li Auto moving from negative free cash flow to positive territory, with projected free cash flow reaching around CN¥27.3 billion by 2029 and remaining in the mid CN¥20 billion range through 2035. Simply Wall St converts those future CN¥ cash flows into today’s value, sums them, and divides by the number of shares to arrive at an intrinsic value of about $36.81 per share.
Compared with the current market price, this implies the shares trade at roughly a 52.8% discount to their estimated fair value, which indicates that the market may be heavily discounting Li Auto’s future cash generation potential.
Result: UNDERVALUED
Our Discounted Cash Flow (DCF) analysis suggests Li Auto is undervalued by 52.8%. Track this in your watchlist or portfolio, or discover 896 more undervalued stocks based on cash flows.
Approach 2: Li Auto Price vs Earnings
For a business that is generating profits, the price to earnings, or PE, ratio is often the go to yardstick because it directly links what investors are paying to the earnings the company is producing today. What counts as a reasonable PE, though, depends heavily on how quickly earnings are expected to grow and how risky or cyclical those earnings might be.
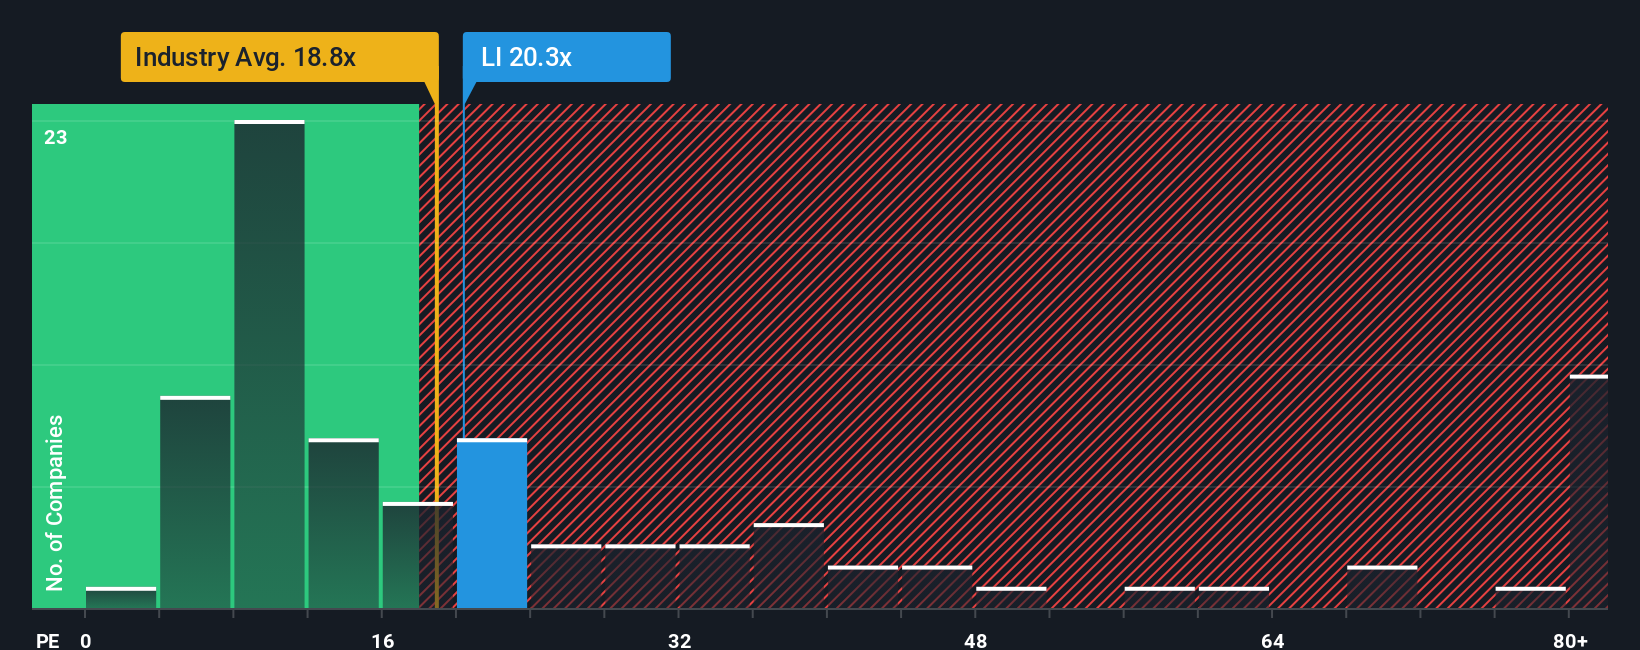
Li Auto currently trades on a PE of about 26.7x, above the broader Auto industry average of roughly 18.8x and also higher than the peer group average of around 22.0x. On the surface, that premium suggests investors are already assuming stronger growth or better quality earnings than many of its rivals.
Simply Wall St’s Fair Ratio metric goes a step further by estimating what PE multiple Li Auto should reasonably command once we factor in its earnings growth profile, margins, industry positioning, market cap and specific risks. For Li Auto, the Fair Ratio is higher, at about 28.9x. This implies that, given its fundamentals, the stock could justify a richer valuation than the current market is assigning. With the actual PE below this Fair Ratio, the shares appear modestly undervalued on this metric.
Result: UNDERVALUED
PE ratios tell one story, but what if the real opportunity lies elsewhere? Discover 1450 companies where insiders are betting big on explosive growth.
Upgrade Your Decision Making: Choose your Li Auto Narrative
Earlier we mentioned that there is an even better way to understand valuation, so let us introduce you to Narratives, a simple way to attach your own story about Li Auto’s future to the numbers by connecting your assumptions for revenue, earnings and margins to a financial forecast, a fair value estimate, and ultimately a buy or sell decision.
A Narrative on Simply Wall St, available on the Community page used by millions of investors, turns your perspective on Li Auto into a structured forecast, then automatically compares your Fair Value with today’s share price. This highlights whether the stock looks attractive or stretched based on your view.
Narratives also update dynamically when new information, such as earnings releases, product launches or major news, comes in. This helps your fair value stay aligned with the latest data rather than going stale.
For example, one Li Auto Narrative might assume revenue growth near the upper end of expectations, stronger margins and a higher future PE multiple. This could lead to a fair value closer to the bullish price target of about $39. A more cautious Narrative could lean on the lower earnings and multiple assumptions that point to a fair value nearer $18. Comparing either to the current price can make it clearer whether Li Auto fits your strategy right now.
Do you think there's more to the story for Li Auto? Head over to our Community to see what others are saying!
This article by Simply Wall St is general in nature. We provide commentary based on historical data and analyst forecasts only using an unbiased methodology and our articles are not intended to be financial advice. It does not constitute a recommendation to buy or sell any stock, and does not take account of your objectives, or your financial situation. We aim to bring you long-term focused analysis driven by fundamental data. Note that our analysis may not factor in the latest price-sensitive company announcements or qualitative material. Simply Wall St has no position in any stocks mentioned.
Have feedback on this article? Concerned about the content? Get in touch with us directly. Alternatively, email editorial-team@simplywallst.com