

Is Ferrari’s Pullback a Long Term Opportunity After Expanding Its Ultra Luxury Lineup?
- If you have ever wondered whether Ferrari stock is a luxury brand trading at a luxury price or a genuine long term opportunity, you are in the right place.
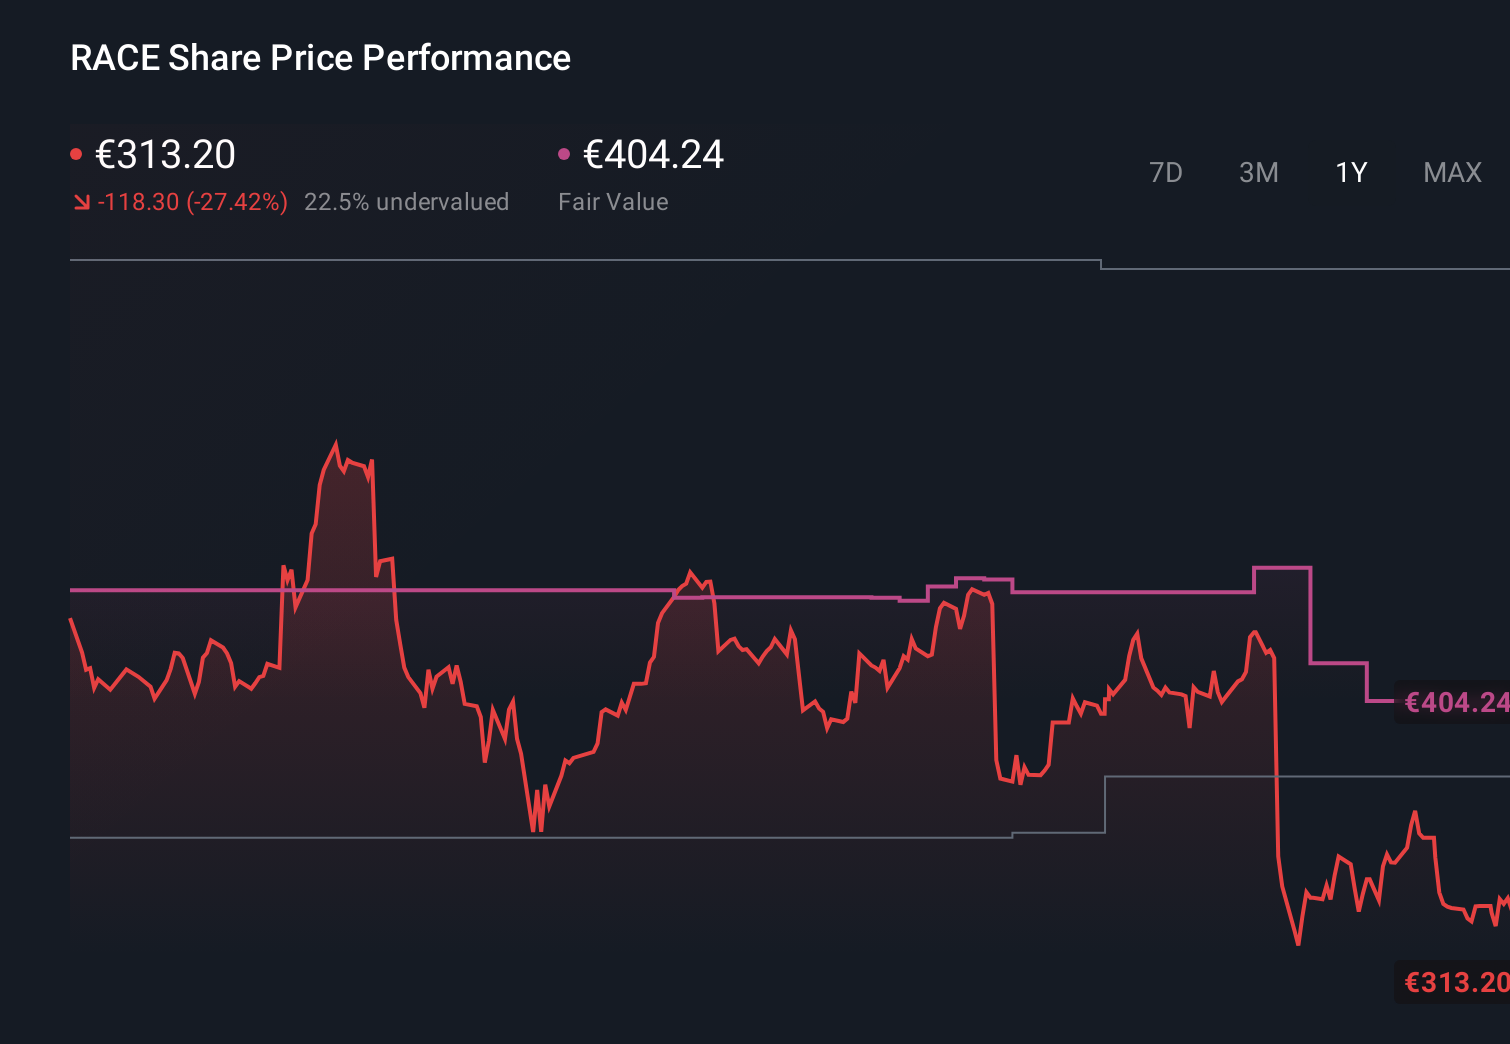
- Despite being down 4.7% over the last week, 8.8% over the last month, and 9.9% year to date, Ferrari is still up 70.3% over three years and 74.6% over five years, which makes its recent pullback especially interesting for valuation focused investors.
- Recent headlines have centered on Ferrari expanding its ultra high end model lineup and deepening partnerships in areas like bespoke personalisation and racing heritage collaborations. This reinforces its scarcity value and pricing power story. At the same time, broader market nervousness around luxury spending and high multiple stocks has put pressure on shares, setting up a tension between narrative strength and valuation reality.
- Right now Ferrari scores just 1/6 on our valuation checks, raising the question of whether this is a richly priced icon or a misunderstood compounder. We will walk through several valuation approaches before finishing with a more holistic way to think about what the stock may be worth.
Ferrari scores just 1/6 on our valuation checks. See what other red flags we found in the full valuation breakdown.
Approach 1: Ferrari Discounted Cash Flow (DCF) Analysis
A Discounted Cash Flow model estimates what a business is worth today by projecting the cash it can generate in the future and discounting those cash flows back to the present.
Ferrari generated roughly €1.28 billion in free cash flow over the last twelve months, and analysts expect this to rise steadily, with Simply Wall St extrapolating those forecasts beyond the initial analyst window. On this basis, projected free cash flow reaches about €1.93 billion by 2029 and continues to climb through the following years as growth gradually slows in the second stage of the model.
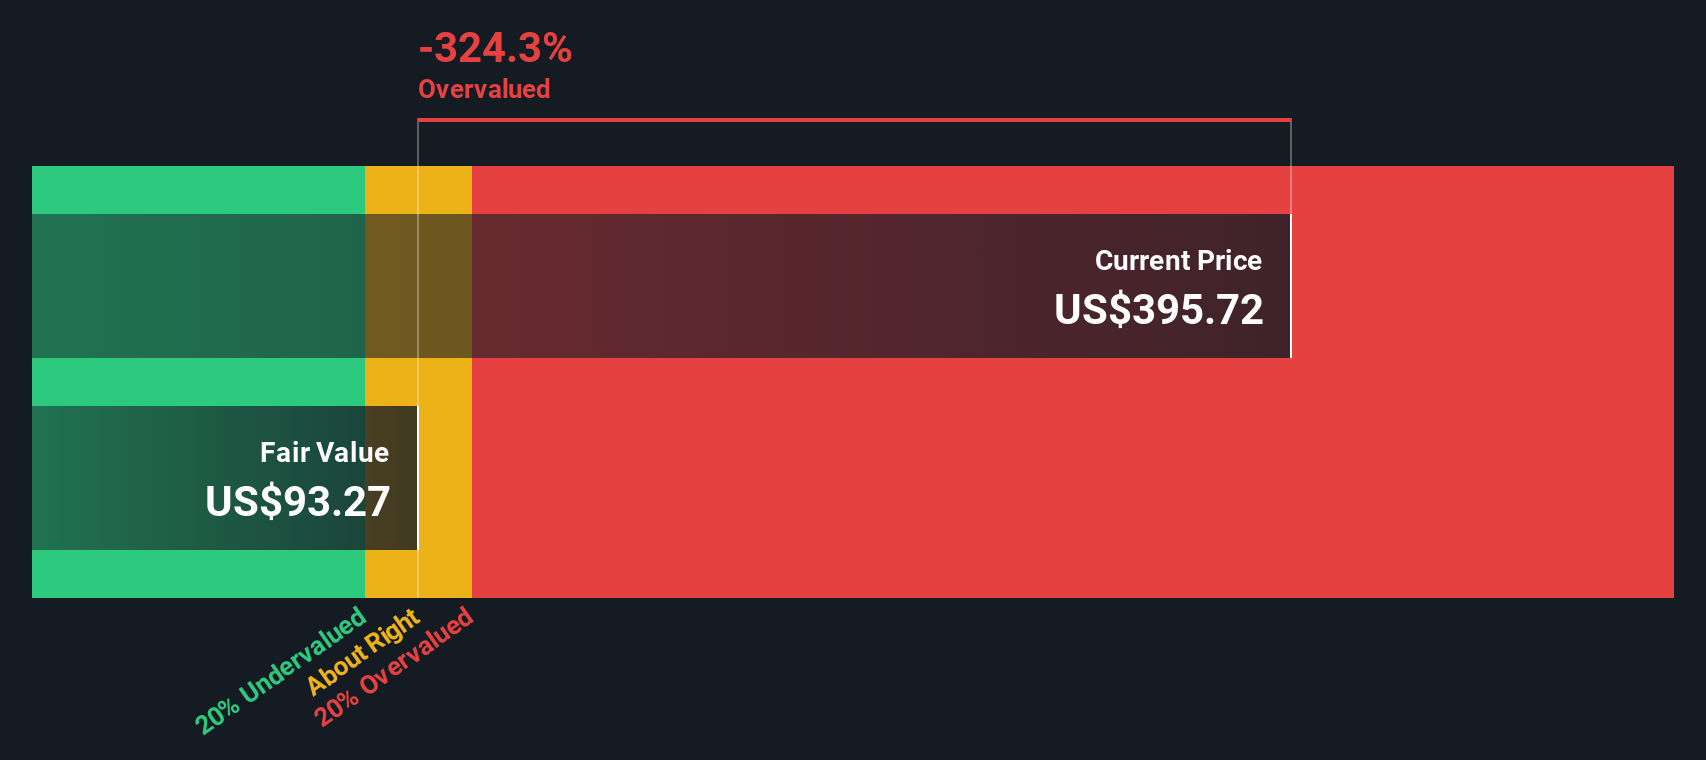
These future cash flows are discounted back to today using a required return for equity holders, producing an estimated intrinsic value of about $103 per share. Compared with the current share price, this implies the stock is roughly 264.6% above the DCF fair value, suggesting that the market is paying a substantial premium over what the cash flow profile alone would justify.
Result: OVERVALUED
Our Discounted Cash Flow (DCF) analysis suggests Ferrari may be overvalued by 264.6%. Discover 893 undervalued stocks or create your own screener to find better value opportunities.
Approach 2: Ferrari Price vs Earnings
For profitable businesses like Ferrari, the price to earnings ratio is often the most intuitive way to gauge valuation because it links what investors pay directly to the profits the company generates today.
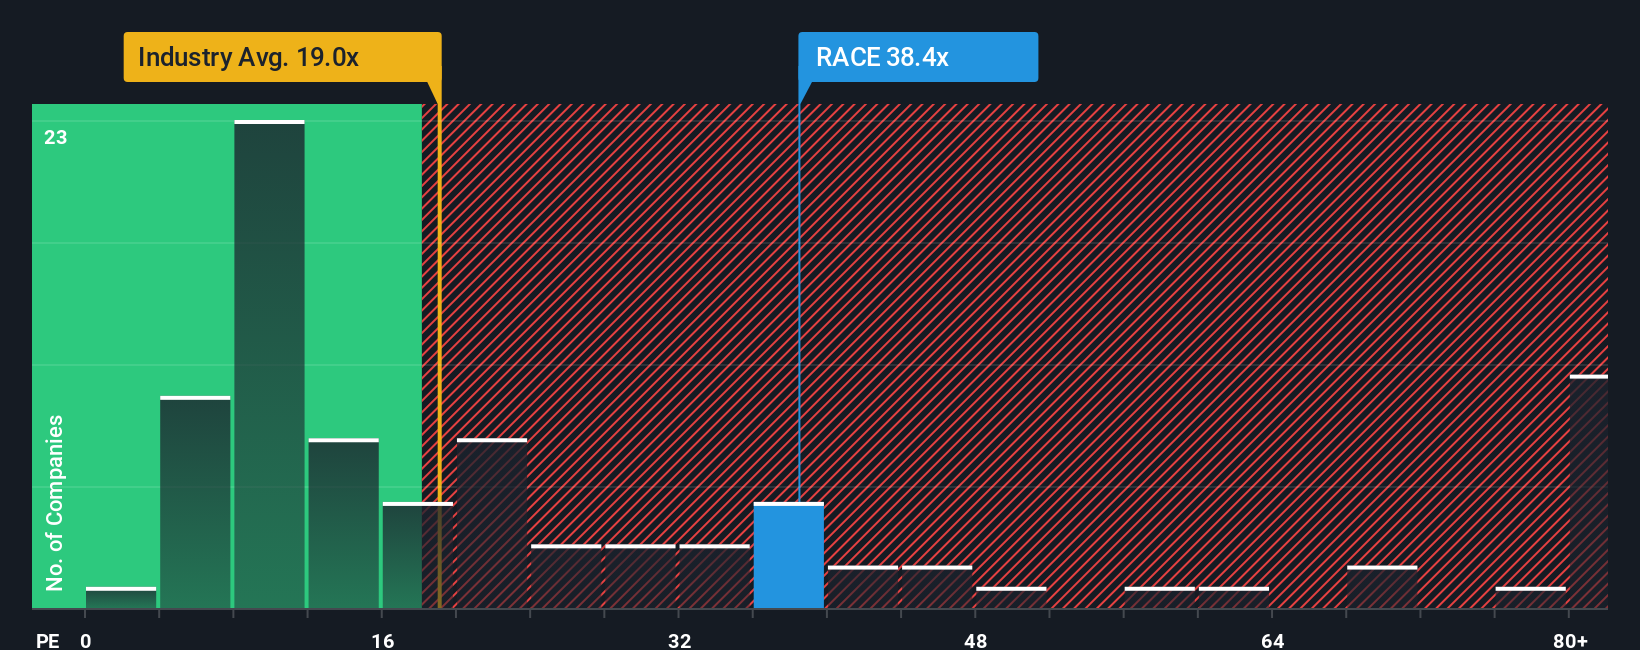
What counts as a fair PE depends on how fast earnings are expected to grow and how risky those earnings are. Strong, resilient growth typically justifies a higher multiple, while cyclical or uncertain profits deserve a lower one. Ferrari currently trades on about 36x earnings, which is almost double both the Auto industry average of around 19x and the broader peer group average of roughly 18x.
Simply Wall St’s Fair Ratio framework goes a step further than simple comparisons by estimating what PE Ferrari should trade on given its earnings growth outlook, high margins, industry, market cap and risk profile. On this basis, Ferrari’s Fair Ratio is about 17x, which implies that, even after accounting for its superior fundamentals, the market is still assigning a substantial premium to the stock’s earnings power.
Result: OVERVALUED
PE ratios tell one story, but what if the real opportunity lies elsewhere? Discover 1451 companies where insiders are betting big on explosive growth.
Upgrade Your Decision Making: Choose your Ferrari Narrative
Earlier we mentioned that there is an even better way to understand valuation. Let us introduce you to Narratives, a simple way to connect your view of Ferrari’s story to a set of revenue, earnings and margin forecasts. These then flow through to a fair value that you can easily compare to the current share price to decide whether to buy, hold or sell, all within the Narratives tool on Simply Wall St’s Community page that millions of investors already use. Each Narrative automatically updates as new news or earnings arrive. Ferrari is a great example of how reasonable people can disagree. Some investors build bullish Narratives around expanding infrastructure, higher margins and aggressive buybacks that support fair values well above the current price. More cautious investors focus on risks like brand dilution, higher fixed costs and sector headwinds, leading them to project slower growth, lower future PE multiples and therefore much lower fair values. Your job is not to guess who is right, but to choose or create the Narrative that best matches what you believe is most probable.
Do you think there's more to the story for Ferrari? Head over to our Community to see what others are saying!
This article by Simply Wall St is general in nature. We provide commentary based on historical data and analyst forecasts only using an unbiased methodology and our articles are not intended to be financial advice. It does not constitute a recommendation to buy or sell any stock, and does not take account of your objectives, or your financial situation. We aim to bring you long-term focused analysis driven by fundamental data. Note that our analysis may not factor in the latest price-sensitive company announcements or qualitative material. Simply Wall St has no position in any stocks mentioned.
Have feedback on this article? Concerned about the content? Get in touch with us directly. Alternatively, email editorial-team@simplywallst.com