

Is Titan America (TTAM) Pricing In Too Much Optimism After Recent Share Price Moves?
- If you are wondering whether Titan America at US$17.25 offers good value or is already pricing in a lot of optimism, you are asking the right question and this article is built to help you frame that clearly.
- Over shorter timeframes the stock has moved around, with returns of 4.2% over the last 7 days, 2.1% over the last 30 days and 3.2% year to date. This may have caught your eye as either early momentum or a shift in risk perception.
- Recently, investors have been reacting to company specific updates and sector headlines that influence sentiment around building materials demand and capital spending. These developments help explain why Titan America's price has been more active in the near term and provide context for a closer look at what you might actually be paying for.
- Titan America currently has a valuation score of 4 out of 6, based on how often it screens as undervalued across several checks. Next, we will break down what those methods say about the stock, before finishing with a way to think about value that goes beyond any single model.
Approach 1: Titan America Discounted Cash Flow (DCF) Analysis
A Discounted Cash Flow, or DCF, model estimates what a business could be worth by projecting the cash it might generate in the future and then discounting those cash flows back to today.
For Titan America, the model used is a 2 Stage Free Cash Flow to Equity approach, based on cash flows in US$. The latest twelve month free cash flow is about $126.9 million. Analyst and extrapolated projections suggest free cash flow reaching about $472.1 million in 2035, with a path that includes figures such as $120.4 million in 2026 and $276.0 million in 2029. Simply Wall St extends analyst inputs beyond the usual 5 year window to create a 10 year cash flow stream, and then discounts each year back to today using its chosen rate.
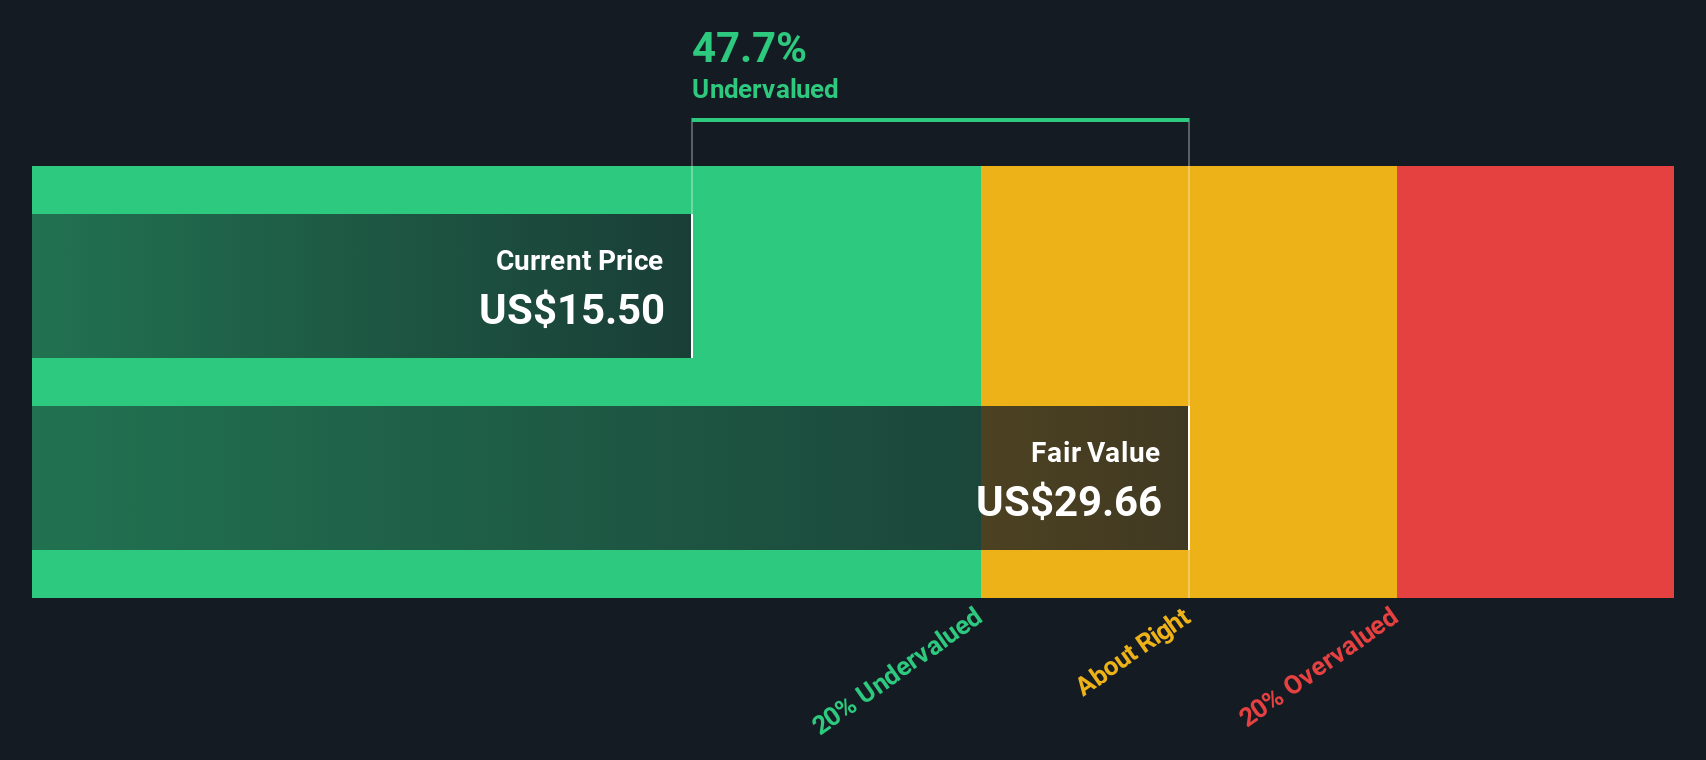
On this basis, the model arrives at an estimated intrinsic value of about $30.20 per share, compared with the current share price of $17.25. That implies the stock screens as about 42.9% undervalued under this particular set of assumptions.
Result: UNDERVALUED
Our Discounted Cash Flow (DCF) analysis suggests Titan America is undervalued by 42.9%. Track this in your watchlist or portfolio, or discover 884 more undervalued stocks based on cash flows.
Approach 2: Titan America Price vs Earnings
P/E is a useful way to look at value for profitable companies because it ties the share price directly to the earnings that shareholders ultimately rely on. In simple terms, a higher P/E usually reflects higher growth expectations or a lower perceived risk, while a lower P/E can suggest more modest growth assumptions or higher risk.
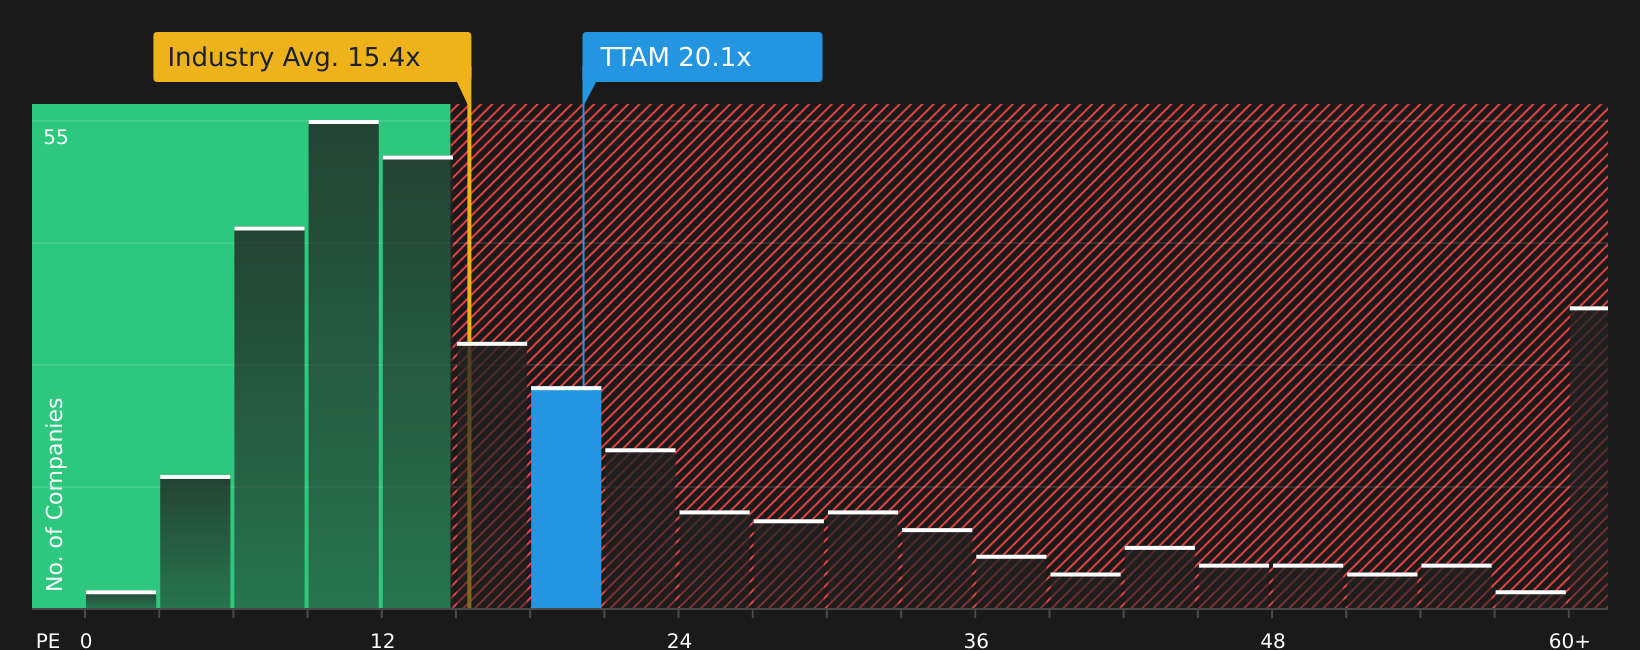
Titan America is currently trading on a P/E of 18.69x. That sits above the Basic Materials industry average of about 15.34x, but below the peer group average of 22.67x. Simply Wall St also calculates a “Fair Ratio” of 19.27x, which is the P/E it estimates would be appropriate given Titan America’s earnings growth profile, industry, profit margins, market cap and risk traits.
This Fair Ratio goes a step further than a simple peer or industry comparison because it adjusts for company specific factors instead of assuming all businesses in the group deserve the same multiple. Comparing Titan America’s current P/E of 18.69x with the Fair Ratio of 19.27x suggests the shares are slightly below that level, so on this measure they screen as undervalued.
Result: UNDERVALUED
P/E ratios tell one story, but what if the real opportunity lies elsewhere? Discover 1440 companies where insiders are betting big on explosive growth.
Upgrade Your Decision Making: Choose your Titan America Narrative
Earlier we mentioned that there is an even better way to understand valuation, so let us introduce you to Narratives, which are simply your story about a company, linked directly to your view of its future numbers.
With a Narrative, you set your assumptions for Titan America’s future revenue, earnings and margins, and the tool converts that story into a full financial forecast and a fair value estimate that sits alongside the current share price.
Narratives are available on Simply Wall St’s Community page, used by millions of investors, and they update automatically when new information such as earnings releases or news is added, so your fair value stays aligned with what is happening.
That helps you decide whether Titan America looks attractively priced or expensive at any point by comparing your Fair Value with the live market Price. You will often see very different Narratives side by side, for example one user valuing Titan America far above today’s US$17.25 and another placing fair value well below that level.
Do you think there's more to the story for Titan America? Head over to our Community to see what others are saying!

This article by Simply Wall St is general in nature. We provide commentary based on historical data and analyst forecasts only using an unbiased methodology and our articles are not intended to be financial advice. It does not constitute a recommendation to buy or sell any stock, and does not take account of your objectives, or your financial situation. We aim to bring you long-term focused analysis driven by fundamental data. Note that our analysis may not factor in the latest price-sensitive company announcements or qualitative material. Simply Wall St has no position in any stocks mentioned.
Have feedback on this article? Concerned about the content? Get in touch with us directly. Alternatively, email editorial-team@simplywallst.com