


Why Westamerica Bancorporation stock is on investors’ radar
Westamerica Bancorporation (WABC) has drawn attention after recent share price moves, with the stock showing positive returns over the past week, month and past 3 months, prompting fresh questions about its valuation.
See our latest analysis for Westamerica Bancorporation.
Looking beyond the recent gains, Westamerica Bancorporation’s 8.30% 90 day share price return and 6.94% year to date share price return contrast with a more modest 2.94% one year total shareholder return. This suggests short term momentum has picked up while longer term rewards have been steadier.
If Westamerica’s recent move has you thinking about where else capital is flowing, it could be a good moment to scan fast growing stocks with high insider ownership for other stocks catching stronger interest.
With Westamerica Bancorporation trading at $51.15 and sitting below a $55.00 analyst target and an indicated intrinsic value gap, the real question is whether this signals a genuine buying window or if the market already reflects future growth.
Price-to-Earnings of 10.8x: Is it justified?
On a simple earnings lens, Westamerica Bancorporation trades on a P/E of 10.8x at a share price of $51.15, which screens cheaper than peers yet still above its own fair ratio estimate.
The P/E ratio compares the current share price to earnings per share and is often used for banks because earnings are a key driver of long term value. For Westamerica Bancorporation, this multiple sits below both the US Banks industry average of 11.8x and the peer group average of 17.9x, which points to a lower price tag being placed on its current earnings than many comparable banks.
However, the company is described as expensive versus an estimated fair P/E of 8.2x, which is the level the market could move towards if pricing aligned more closely with that benchmark. The combination of trading below peers yet above this fair ratio highlights a tension between what similar banks trade on and what regression based modelling suggests might be a more grounded multiple for Westamerica Bancorporation.
Explore the SWS fair ratio for Westamerica Bancorporation
Result: Price-to-Earnings of 10.8x (ABOUT RIGHT)
However, you also need to weigh risks such as annual revenue and net income declines of 4.99% and 11.13%, as well as any shift in analyst sentiment around that $55 target.
Find out about the key risks to this Westamerica Bancorporation narrative.
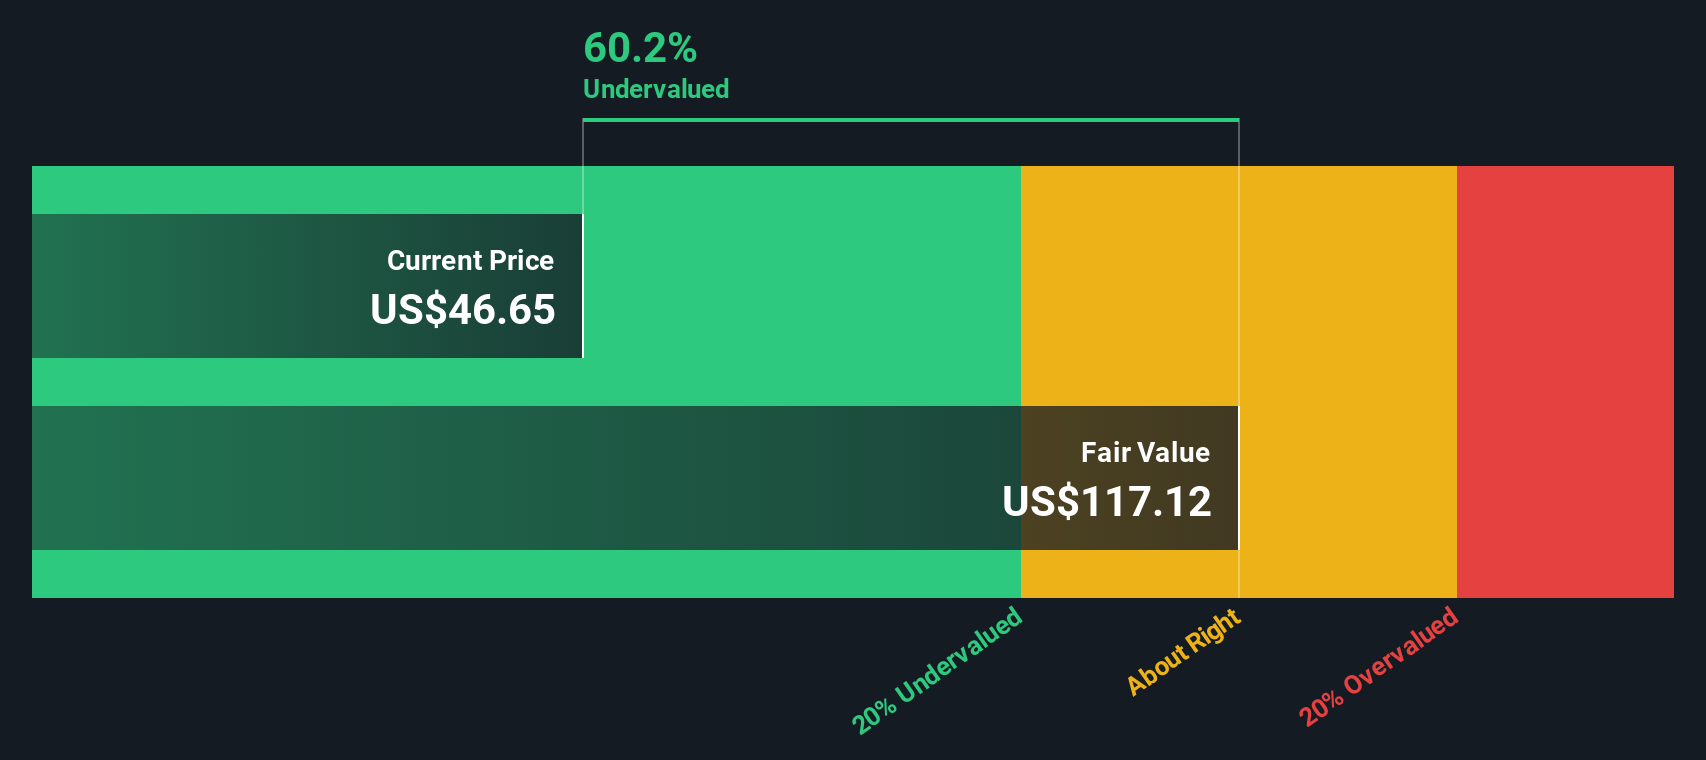
Another view: DCF suggests a very different price
While the 10.8x P/E makes Westamerica Bancorporation look roughly in line with its earnings profile, our DCF model points in the opposite direction. On that approach, the shares at $51.15 sit well below an estimated future cash flow value of $114.87, which raises the question of which signal you trust more.
Look into how the SWS DCF model arrives at its fair value.
Simply Wall St performs a discounted cash flow (DCF) on every stock in the world every day (check out Westamerica Bancorporation for example). We show the entire calculation in full. You can track the result in your watchlist or portfolio and be alerted when this changes, or use our stock screener to discover 883 undervalued stocks based on their cash flows. If you save a screener we even alert you when new companies match - so you never miss a potential opportunity.
Build Your Own Westamerica Bancorporation Narrative
If you interpret the numbers differently or want to test your own perspective, you can build a personalised Westamerica Bancorporation thesis in just a few minutes, starting with Do it your way
A great starting point for your Westamerica Bancorporation research is our analysis highlighting 2 key rewards and 1 important warning sign that could impact your investment decision.
Looking for more investment ideas?
If you stop at just one stock, you could miss opportunities sitting in plain sight, so use the Screener to widen your options and pressure test your thinking.
- Spot potential ideas early by checking out these 3528 penny stocks with strong financials that currently show stronger financial footing than many expect from smaller names.
- Explore technology-related opportunities by scanning these 24 AI penny stocks where artificial intelligence is an important part of each business model.
- Focus on value by reviewing these 883 undervalued stocks based on cash flows that currently trade at prices reflecting less optimistic cash flow expectations than their models indicate.
This article by Simply Wall St is general in nature. We provide commentary based on historical data and analyst forecasts only using an unbiased methodology and our articles are not intended to be financial advice. It does not constitute a recommendation to buy or sell any stock, and does not take account of your objectives, or your financial situation. We aim to bring you long-term focused analysis driven by fundamental data. Note that our analysis may not factor in the latest price-sensitive company announcements or qualitative material. Simply Wall St has no position in any stocks mentioned.
Have feedback on this article? Concerned about the content? Get in touch with us directly. Alternatively, email editorial-team@simplywallst.com