

Is It Time To Reassess United Parks & Resorts (PRKS) After Recent Share Price Weakness?
- Wondering whether United Parks & Resorts at around US$37.49 is a bargain or a value trap right now? This article walks through what the current price might be telling you about the stock.
- The share price is up 5.3% over the last month and 3.5% year to date, but that sits against a 27.6% decline over the last year and a 40.2% decline over three years, which may have shifted how investors see both risk and potential reward.
- Recent coverage around United Parks & Resorts has highlighted the company itself and its positioning in the consumer services space, giving investors more information to reassess the stock. This backdrop helps explain why the price has moved in the shorter term even as longer term returns have been weaker.
- On our valuation checks, United Parks & Resorts scores 5 out of 6. Next we will look at what traditional valuation methods say about that score, before finishing with a different way to think about valuation that could be more useful for long term investors.
Find out why United Parks & Resorts's -27.6% return over the last year is lagging behind its peers.
Approach 1: United Parks & Resorts Discounted Cash Flow (DCF) Analysis
A Discounted Cash Flow, or DCF, model estimates what a company might be worth today by projecting its future cash flows and then discounting those back into today’s dollars. It is essentially asking what all the expected future cash that investors receive could be worth right now.
For United Parks & Resorts, the model used is a 2 Stage Free Cash Flow to Equity approach. The latest twelve month Free Cash Flow is about $162.9 million. Analysts provide specific Free Cash Flow estimates out to 2027, with Simply Wall St extrapolating further to build a 10 year view. In this model, projected Free Cash Flow in 2035 is $369.4 million, with intermediate years between 2026 and 2034 ranging from $239 million to $356.9 million.
When those projected cash flows are discounted back using the DCF framework, the estimated intrinsic value comes out at about $61.69 per share, compared with the current share price of around $37.49. That implies the stock is 39.2% undervalued based on this model.
Result: UNDERVALUED
Our Discounted Cash Flow (DCF) analysis suggests United Parks & Resorts is undervalued by 39.2%. Track this in your watchlist or portfolio, or discover 864 more undervalued stocks based on cash flows.

Approach 2: United Parks & Resorts Price vs Earnings
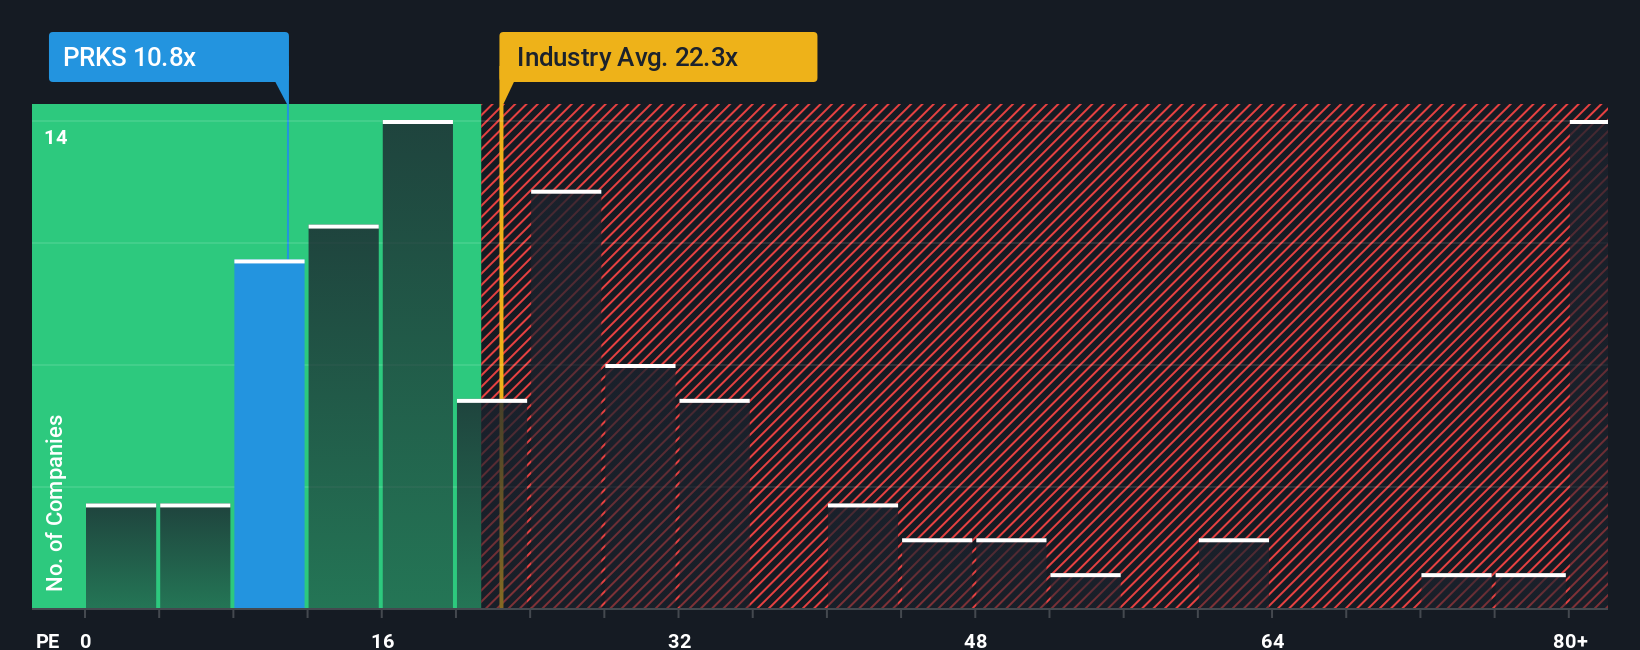
For a profitable company like United Parks & Resorts, the P/E ratio is a useful way to think about what you are paying for each dollar of earnings. Investors typically look for a P/E that lines up with their expectations for future growth and the risk they are taking on. A higher P/E can be associated with stronger expected growth or lower perceived risk, while a lower P/E can reflect the opposite.
United Parks & Resorts currently trades on a P/E of 11.29x. That sits below both the Hospitality industry average P/E of 21.87x and the peer group average of 22.72x. Simply Wall St also calculates a proprietary “Fair Ratio” for the stock, which estimates what a more appropriate P/E could be after considering factors such as the company’s earnings growth profile, profit margins, industry, market cap and specific risks. This Fair Ratio for United Parks & Resorts is 16.23x.
Because the Fair Ratio is tailored to the company’s own characteristics, it can be more informative than a simple comparison with industry or peer averages. Here, the Fair Ratio of 16.23x is above the current P/E of 11.29x, which points to the shares trading below that fair level on this metric.
Result: UNDERVALUED
P/E ratios tell one story, but what if the real opportunity lies elsewhere? Discover 1429 companies where insiders are betting big on explosive growth.
Upgrade Your Decision Making: Choose your United Parks & Resorts Narrative
Earlier we mentioned that there is an even better way to understand valuation, so let us introduce you to Narratives, which are essentially your own story about a company tied directly to numbers like fair value, and estimates for future revenue, earnings and margins.
On Simply Wall St’s Community page, you can create or explore Narratives for United Parks & Resorts that connect what you believe about the business to a financial forecast and then to a fair value estimate, all in one place used by millions of investors. Narratives help you decide what to do by lining up your view of fair value against the current share price, so you can judge for yourself whether the stock looks attractive or expensive on your terms. They are also kept current because key inputs refresh when new information such as earnings releases or major news is added. For United Parks & Resorts, one investor might see the business as worth far more than the market price while another might set a fair value closer to or even below today’s US$37.49, yet both are using the same Narrative framework to reach very different conclusions.
Do you think there's more to the story for United Parks & Resorts? Head over to our Community to see what others are saying!

This article by Simply Wall St is general in nature. We provide commentary based on historical data and analyst forecasts only using an unbiased methodology and our articles are not intended to be financial advice. It does not constitute a recommendation to buy or sell any stock, and does not take account of your objectives, or your financial situation. We aim to bring you long-term focused analysis driven by fundamental data. Note that our analysis may not factor in the latest price-sensitive company announcements or qualitative material. Simply Wall St has no position in any stocks mentioned.
Have feedback on this article? Concerned about the content? Get in touch with us directly. Alternatively, email editorial-team@simplywallst.com