

Is NCR Atleos (NATL) Pricing Look Stretched After Recent Spin Off Transition
- If you are asking whether NCR Atleos at US$37.63 is a bargain, fully priced, or something in between, this article is going to walk you through the key signals that matter for valuation.
- The stock has moved around recently, with a 5.8% decline over the last 7 days, a 3.5% decline over the last 30 days, and returns of 1.1% year to date and 15.7% over the last year.
- Recent coverage has focused on NCR Atleos as a stand alone ATM and financial technology infrastructure business following its separation from its former parent. This has put more attention on its balance sheet, capital allocation, and the sustainability of its cash flows. That context helps explain why the market has been reassessing the stock as investors weigh its standalone prospects and risks.
- Right now NCR Atleos has a valuation score of 0 out of 6. We will look at how different valuation methods arrive at that result and then finish with a more holistic way to think about what the market might be pricing in.
NCR Atleos scores just 0/6 on our valuation checks. See what other red flags we found in the full valuation breakdown.
Approach 1: NCR Atleos Excess Returns Analysis
The Excess Returns model looks at how much profit a company is expected to earn above the return that shareholders require, based on the equity cost. Instead of focusing on short term earnings, it starts with what the business can earn on its equity over time.
For NCR Atleos, the model uses a Book Value of US$4.47 per share and a Stable EPS of US$1.24 per share, sourced from the median return on equity over the past 5 years. The Average Return on Equity used in the model is 32.20%, while the Cost of Equity is US$0.36 per share. The Excess Return is US$0.87 per share, and the Stable Book Value input is US$3.84 per share, based on the median book value over the past 5 years.
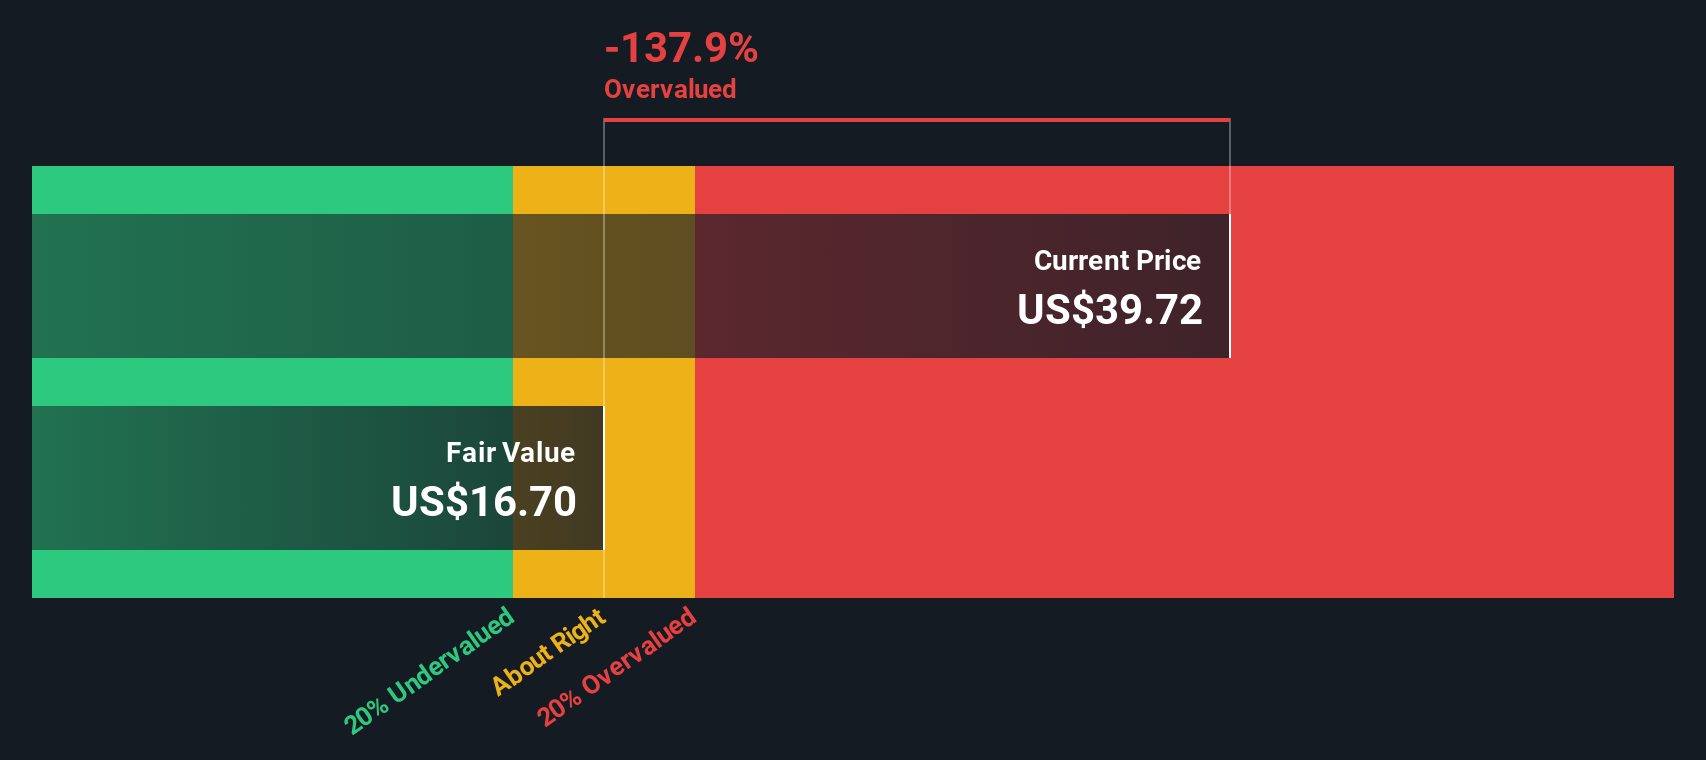
Putting these pieces together, the Excess Returns model arrives at an intrinsic value of US$17.77 per share. Compared with the current share price of US$37.63, this indicates that, under this approach, the stock is assessed to be 111.7% overvalued.
Result: OVERVALUED
Our Excess Returns analysis suggests NCR Atleos may be overvalued by 111.7%. Discover 874 undervalued stocks or create your own screener to find better value opportunities.
Approach 2: NCR Atleos Price vs Earnings
For a profitable company like NCR Atleos, the P/E ratio is a useful way to think about what you are paying for each dollar of earnings. It links the share price directly to earnings power, which is usually the main driver of long term returns for shareholders.
What counts as a “normal” P/E really depends on how the market views growth potential and risk. Higher expected growth or lower perceived risk can support a higher P/E, while slower growth or higher risk usually points to a lower multiple.
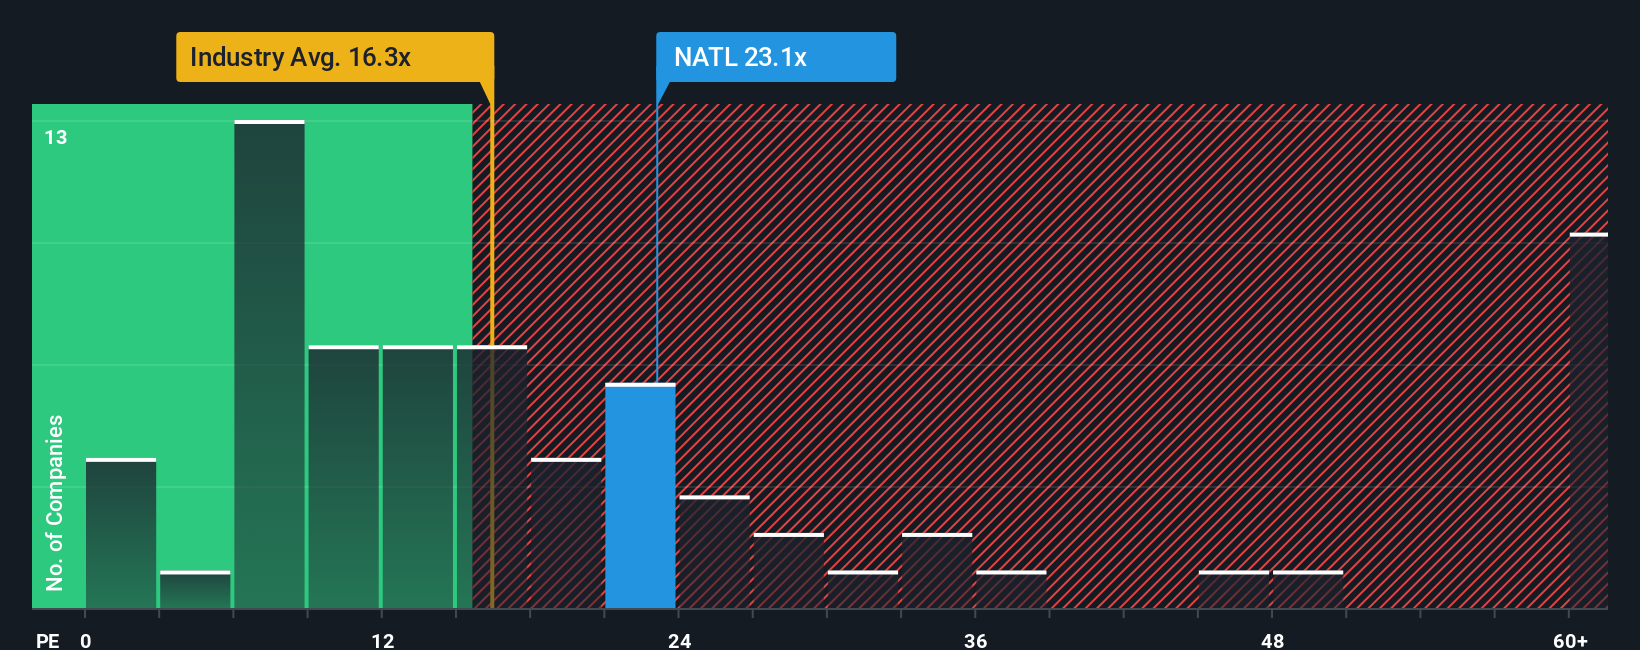
NCR Atleos currently trades on a P/E of 21.23x. That is above the Diversified Financial industry average P/E of 14.48x, and also above the peer group average of 10.29x. Simply Wall St’s Fair Ratio for NCR Atleos is 20.00x, which is an estimate of what a reasonable P/E could be for this specific business, taking into account factors such as its earnings profile, industry, profit margins, market value and risk characteristics.
The Fair Ratio can be more informative than a simple peer or industry comparison because it adjusts for company specific traits instead of assuming all businesses deserve the same multiple. With the actual P/E only slightly above the Fair Ratio, NCR Atleos appears to be priced roughly in line with what this framework would suggest.
Result: ABOUT RIGHT
P/E ratios tell one story, but what if the real opportunity lies elsewhere? Discover 1429 companies where insiders are betting big on explosive growth.
Upgrade Your Decision Making: Choose your NCR Atleos Narrative
Earlier we mentioned that there is an even better way to understand valuation, so let us introduce you to Narratives, which let you attach a clear story to your numbers such as what you think is a fair value and how you see future revenue, earnings and margins for NCR Atleos.
A Narrative links what you believe about a company, for example its competitive position or balance sheet priorities, to a simple forecast and then to a fair value that you can compare directly with the current share price.
On Simply Wall St, used by millions of investors, Narratives sit in the Community page and are designed so you can quickly see whether your Fair Value suggests the stock is attractive, fully priced, or expensive relative to the live market price.
They also update automatically when new information such as earnings reports or major news is added to the platform, so your story and valuation stay in sync without extra effort from you.
For NCR Atleos, one investor might use a conservative Narrative with lower revenue expectations and a cautious fair value, while another might apply a more optimistic Narrative with stronger revenue assumptions and a higher fair value, reflecting their different views on the business.
Do you think there's more to the story for NCR Atleos? Head over to our Community to see what others are saying!
This article by Simply Wall St is general in nature. We provide commentary based on historical data and analyst forecasts only using an unbiased methodology and our articles are not intended to be financial advice. It does not constitute a recommendation to buy or sell any stock, and does not take account of your objectives, or your financial situation. We aim to bring you long-term focused analysis driven by fundamental data. Note that our analysis may not factor in the latest price-sensitive company announcements or qualitative material. Simply Wall St has no position in any stocks mentioned.
Have feedback on this article? Concerned about the content? Get in touch with us directly. Alternatively, email editorial-team@simplywallst.com