

Is ACV Auctions (ACVA) Share Price Slide Creating A Long Term Opportunity For Investors
- If you are wondering whether ACV Auctions' share price reflects its underlying value, this article walks through the key numbers that matter to you as a long term investor.
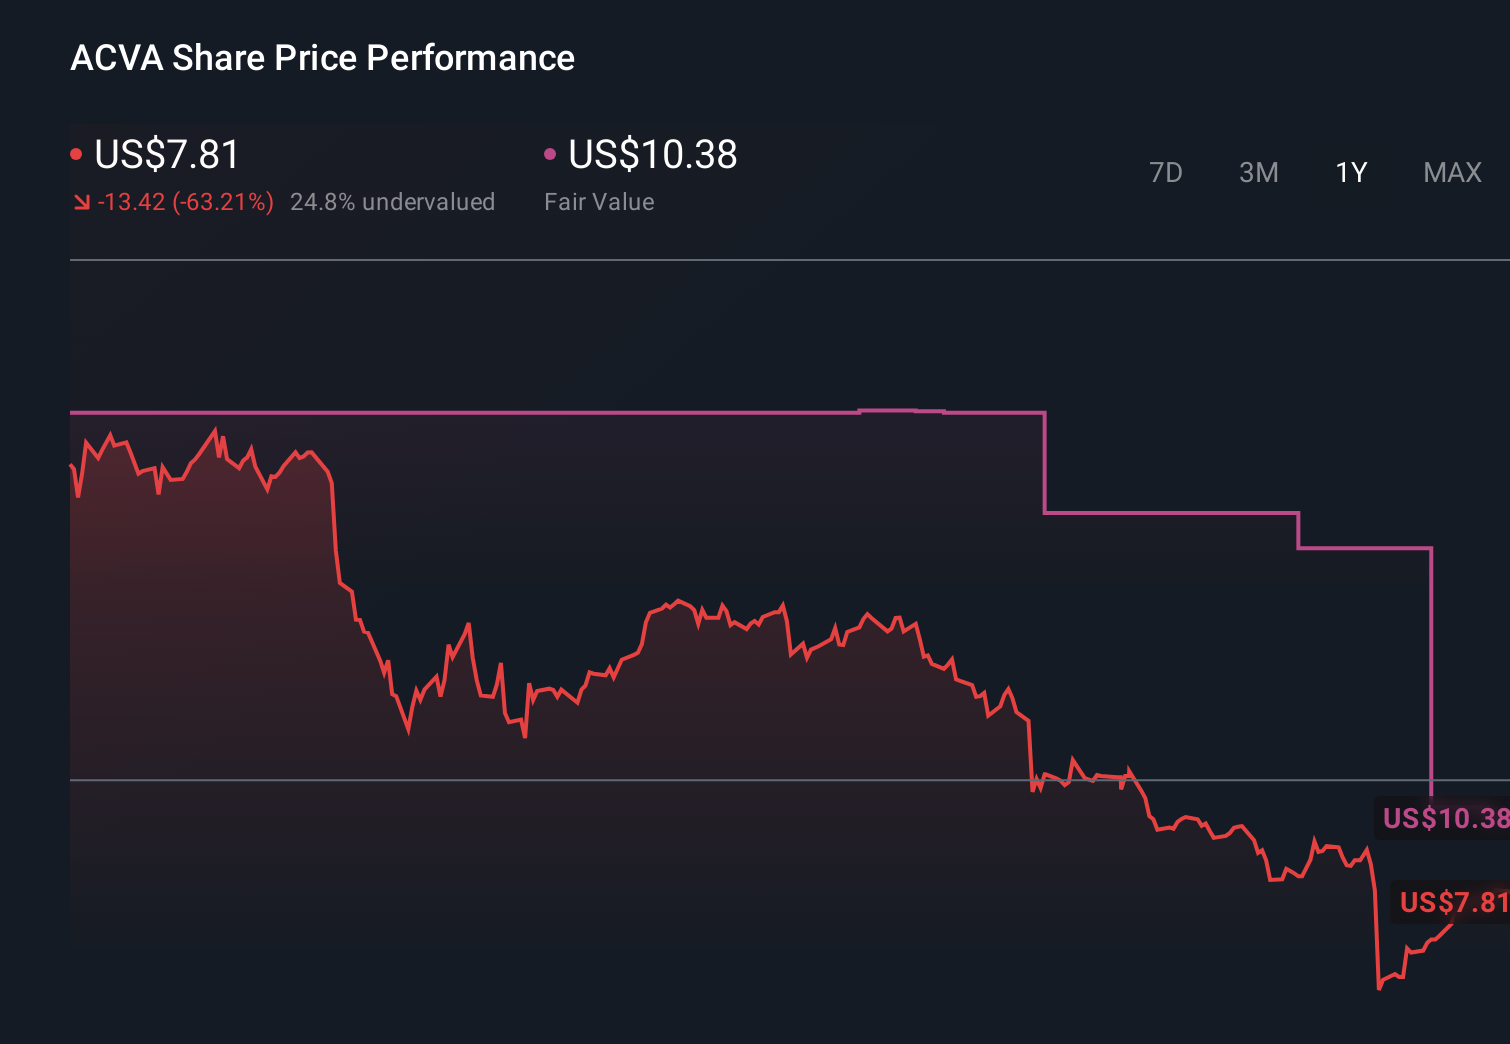
- The stock last closed at US$8.35, with returns of 1.1% over 30 days, a 0.7% gain year to date, but a 60.9% decline over the past year and a 14.8% decline over three years.
- Recent market attention has focused less on headlines and more on how ACV Auctions' business model and sector exposure stack up against peers. This has framed the way investors interpret these share price moves. That context is important, because it means current pricing may be driven as much by sentiment as by company specific fundamentals.
- On Simply Wall St's valuation checks, ACV Auctions scores 2 out of 6. We will look at what different valuation methods say about that score and then finish by walking through a more holistic way to think about what the stock might be worth.
ACV Auctions scores just 2/6 on our valuation checks. See what other red flags we found in the full valuation breakdown.
Approach 1: ACV Auctions Discounted Cash Flow (DCF) Analysis
A Discounted Cash Flow, or DCF, model takes estimates of the cash a business could generate in the future and discounts those cash flows back to what they might be worth in today's dollars.
For ACV Auctions, the latest twelve month free cash flow is about $45.25 million. Simply Wall St uses a 2 Stage Free Cash Flow to Equity model that blends analyst forecasts with its own extrapolations. Analyst inputs cover the earlier years, then the model extends those figures and arrives at a projected free cash flow of $307.5 million in 2030. Beyond the analyst horizon, the ten year path includes projected and discounted cash flows each year through 2035, all expressed in US$.
When those projected cash flows are discounted back and summed, the model arrives at an estimated intrinsic value of about $60.98 per share. Compared with the recent share price of $8.35, this suggests the stock is 86.3% undervalued on this DCF view.
Result: UNDERVALUED
Our Discounted Cash Flow (DCF) analysis suggests ACV Auctions is undervalued by 86.3%. Track this in your watchlist or portfolio, or discover 876 more undervalued stocks based on cash flows.

Approach 2: ACV Auctions Price vs Sales
For companies where earnings are limited or volatile, the P/S ratio can be a useful way to think about value, because it compares what you pay for each dollar of revenue rather than focusing on profit alone.
In general, higher growth expectations and lower perceived risk can justify a higher P/S ratio. Slower growth or higher risk usually point to a lower, more conservative multiple. So the question is what feels like a reasonable P/S range for ACV Auctions today, given its sector and profile.
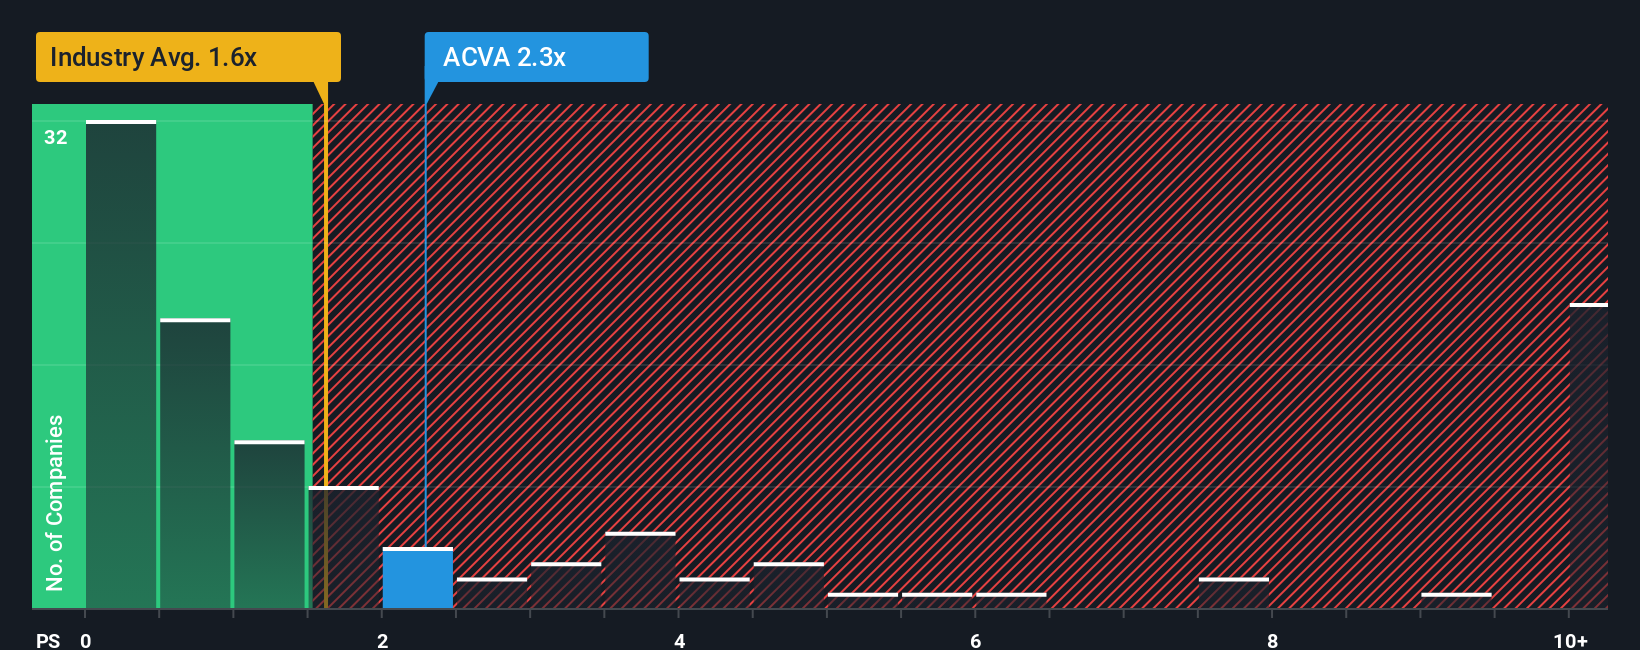
ACV Auctions is currently trading on a P/S of 1.95x. That sits above the Commercial Services industry average of about 1.30x and above the peer group average of 1.20x. Simply Wall St also calculates a Fair Ratio for the stock of 1.15x. This Fair Ratio is a proprietary estimate of what the P/S might be given ACV Auctions' earnings growth outlook, industry, profit margins, market cap and risk profile. Because it ties the multiple to the company’s own fundamentals rather than broad group averages, it can be a more tailored reference point than a simple industry or peer comparison.
Comparing the current 1.95x P/S with the 1.15x Fair Ratio suggests the shares are trading above that modelled fair level.
Result: OVERVALUED
P/S ratios tell one story, but what if the real opportunity lies elsewhere? Discover 1422 companies where insiders are betting big on explosive growth.
Upgrade Your Decision Making: Choose your ACV Auctions Narrative
Earlier we mentioned that there is an even better way to think about valuation, so let us introduce Narratives, which are simply your own story about a company linked directly to your assumptions for fair value, future revenue, earnings and margins.
On Simply Wall St, Narratives live in the Community page and let you connect the qualitative picture, such as ACV Auctions' business model or competitive position, to a clear financial forecast and a fair value estimate you can compare with the current share price to decide whether the stock looks attractive or not for you.
Because Narratives update automatically when new information such as earnings releases or major news is added, your fair value view stays current without you needing to rebuild your whole model each time.
For example, one ACV Auctions Narrative on the Community page might assume very cautious revenue growth and modest margins, while another assumes stronger revenue growth and higher profitability, which naturally leads to very different fair value estimates for the same stock.
Do you think there's more to the story for ACV Auctions? Head over to our Community to see what others are saying!
This article by Simply Wall St is general in nature. We provide commentary based on historical data and analyst forecasts only using an unbiased methodology and our articles are not intended to be financial advice. It does not constitute a recommendation to buy or sell any stock, and does not take account of your objectives, or your financial situation. We aim to bring you long-term focused analysis driven by fundamental data. Note that our analysis may not factor in the latest price-sensitive company announcements or qualitative material. Simply Wall St has no position in any stocks mentioned.
Have feedback on this article? Concerned about the content? Get in touch with us directly. Alternatively, email editorial-team@simplywallst.com