

Is It Too Late To Consider Helios Technologies (HLIO) After A 47.7% One Year Rally?
- If you are wondering whether Helios Technologies is attractively priced or getting ahead of itself, you are in the right place to size up what the current share price might actually represent.
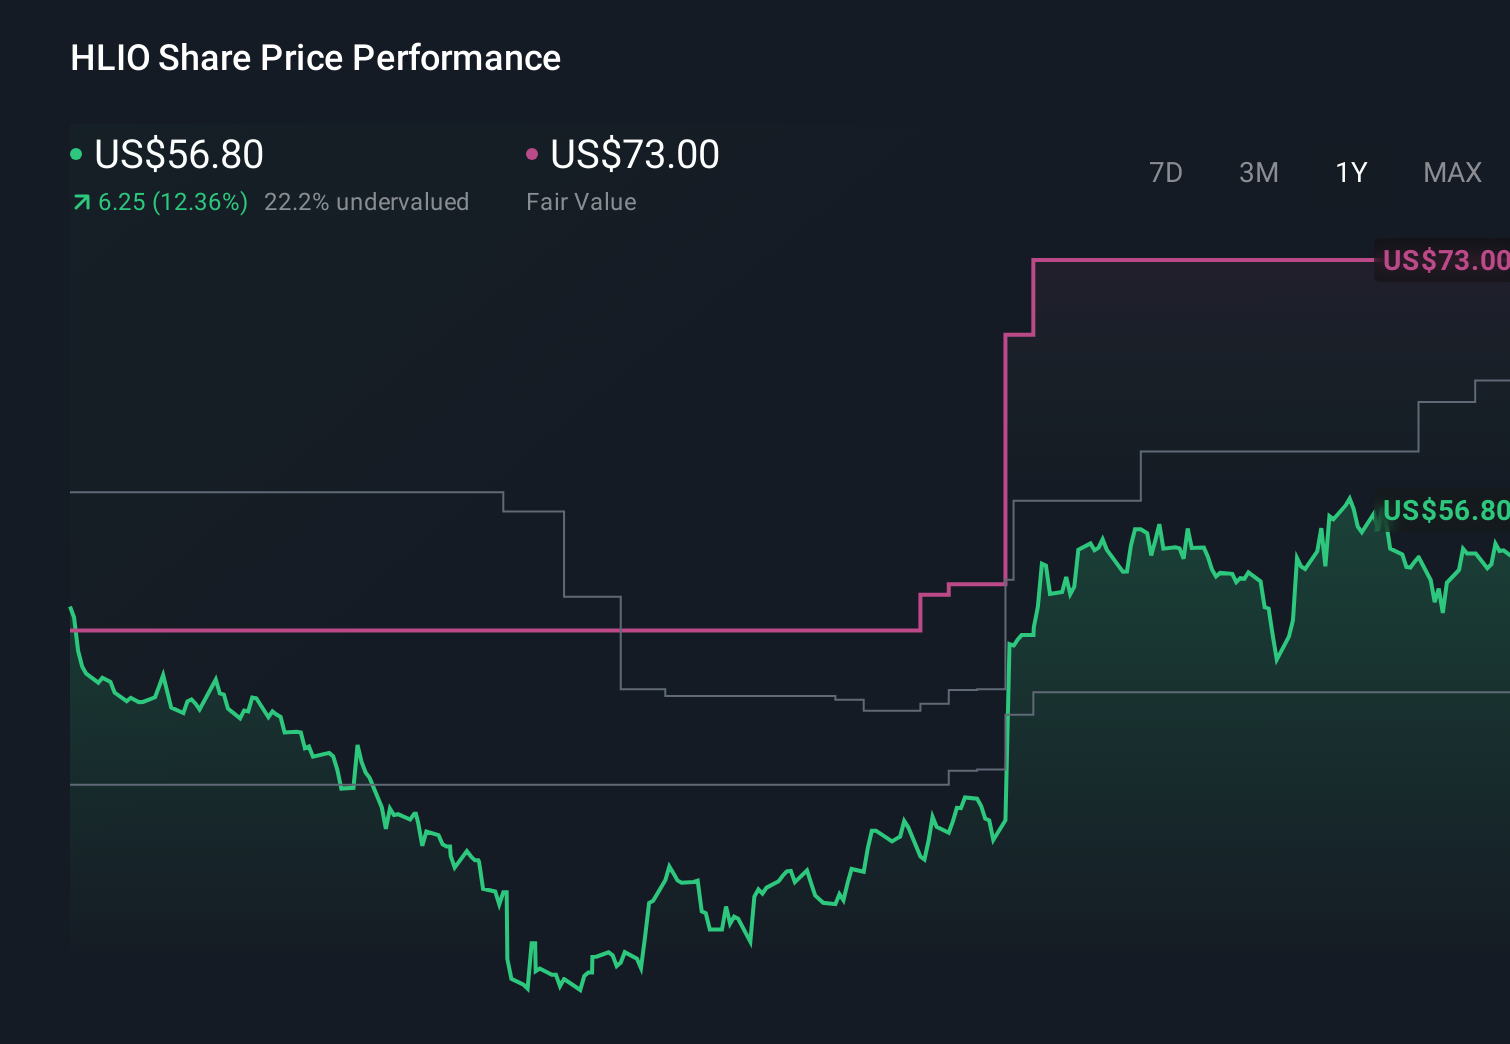
- The stock recently closed at US$64.05, with a 30 day return of 17.5% and a 1 year return of 47.7%. These figures can change how investors view both its growth potential and its risks.
- Recent news around Helios has focused on evergreen coverage of the company and its position in the capital goods space. This helps frame how the market is currently treating the stock. This broader context is useful when you look at the mixed picture in shorter term returns, such as the 7 day return of a 5.1% decline compared with the 5 year return of 15.4%.
- Right now Helios carries a valuation score of 1 out of 6. Below we look at how different methods judge that price and then finish with a way of assessing value that can give you a clearer overall story.
Helios Technologies scores just 1/6 on our valuation checks. See what other red flags we found in the full valuation breakdown.
Approach 1: Helios Technologies Discounted Cash Flow (DCF) Analysis
A Discounted Cash Flow model estimates what a company could be worth by projecting its future cash flows and then discounting those back to today to reflect risk and the time value of money.
For Helios Technologies, the model used is a 2 Stage Free Cash Flow to Equity approach, based on the company generating last twelve month free cash flow of about $83.6 million. Analysts provide explicit free cash flow estimates for the next few years, with later years extrapolated by Simply Wall St. For example, projected free cash flow reaches about $190.4 million in 2035, with intermediate estimates such as $92.2 million in 2026 and $135.5 million in 2029, all in dollars.
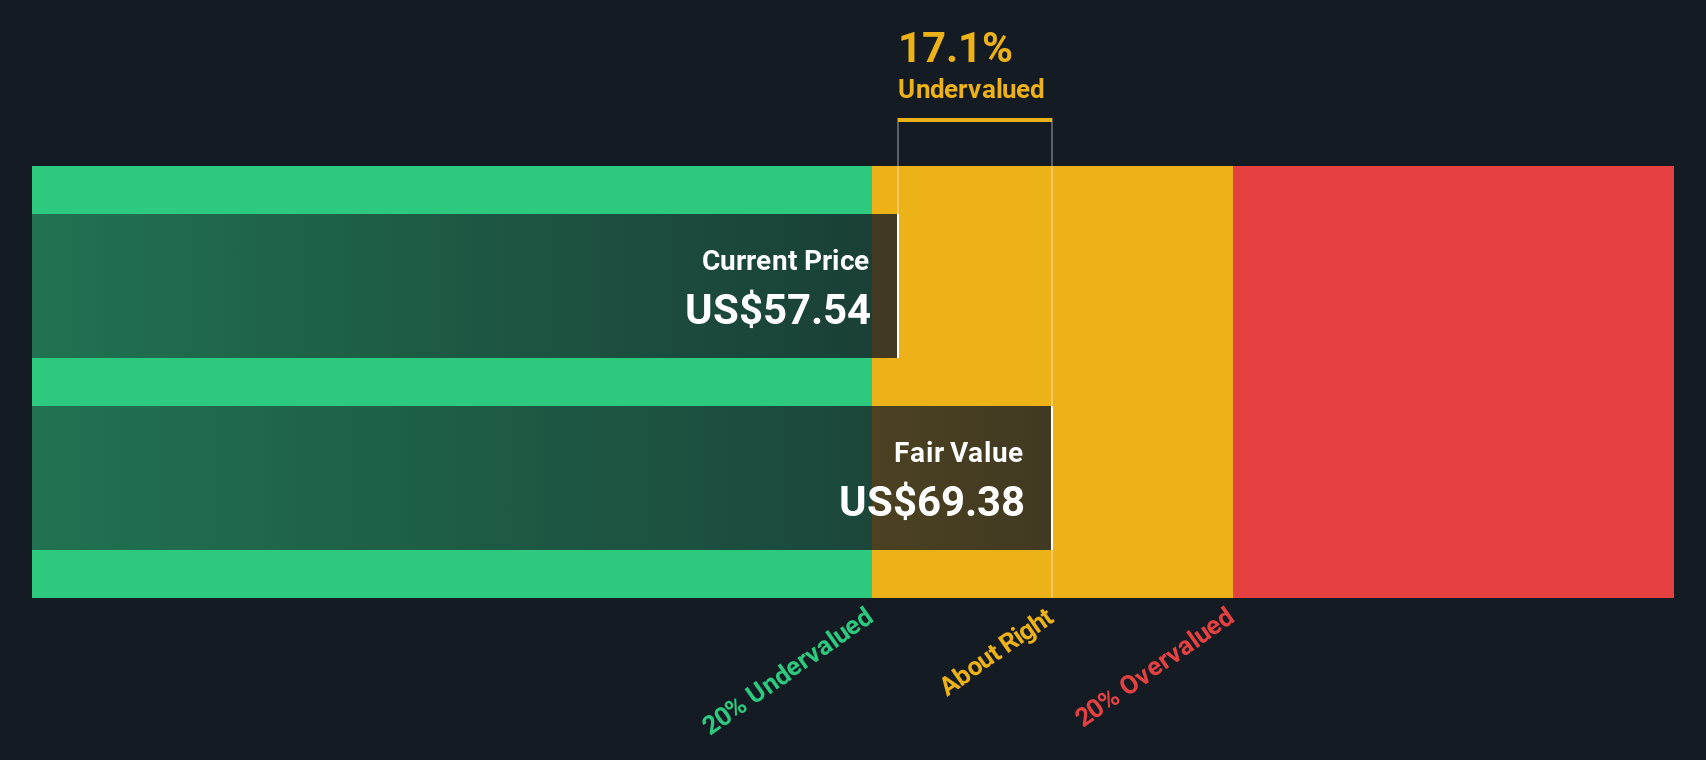
When these cash flows are discounted back, the model arrives at an estimated intrinsic value of about $73.04 per share. Compared with the recent share price of $64.05, this implies the stock trades at roughly a 12.3% discount on this cash flow view.
Result: UNDERVALUED
Our Discounted Cash Flow (DCF) analysis suggests Helios Technologies is undervalued by 12.3%. Track this in your watchlist or portfolio, or discover 877 more undervalued stocks based on cash flows.
Approach 2: Helios Technologies Price vs Earnings
For profitable companies, the P/E ratio is a useful way to think about what you are paying for each dollar of earnings. It links the share price directly to the bottom line and reflects how the market weighs those earnings today.
What counts as a “normal” P/E depends on how the market views a company’s growth prospects and risks. Higher expected growth or perceived resilience can support a higher P/E, while more uncertainty or weaker growth tends to justify a lower one.
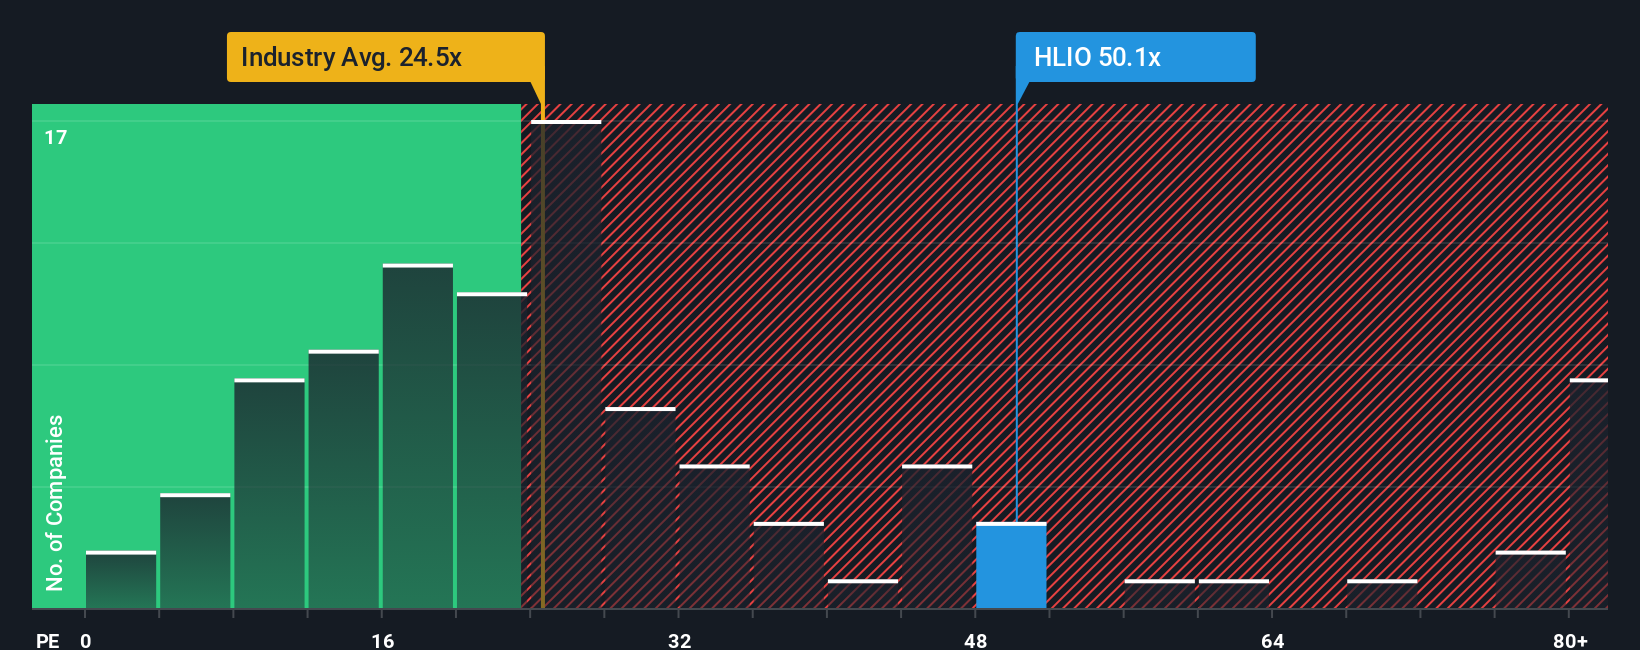
Helios Technologies currently trades on a P/E of 63x. That compares with the Machinery industry average of about 27.7x and a peer average of 38x, so the stock is priced above both of those benchmarks. Simply Wall St’s Fair Ratio for Helios is 37.54x, which is the P/E that would be expected given factors such as its earnings profile, profit margins, industry, market cap and risk characteristics.
This Fair Ratio can be more informative than a simple peer or industry comparison because it adjusts for company specific traits rather than relying on broad group averages. With the actual P/E of 63x sitting well above the Fair Ratio of 37.54x, the shares appear expensive on this multiple-based view.
Result: OVERVALUED
P/E ratios tell one story, but what if the real opportunity lies elsewhere? Discover 1416 companies where insiders are betting big on explosive growth.
Upgrade Your Decision Making: Choose your Helios Technologies Narrative
Earlier we mentioned that there is an even better way to understand valuation, so let us introduce you to Narratives, a simple way to connect the story you believe about Helios Technologies with the numbers behind it. A Narrative is your view of the company written into a forecast, where your assumptions about future revenue, earnings and margins are translated into a Fair Value estimate. On Simply Wall St, within the Community page used by millions of investors, Narratives give you an easy tool to compare that Fair Value to the current share price so you can judge whether the stock looks attractive or stretched on your terms. Each Narrative updates automatically when new information such as news or earnings is added, so your story and Fair Value stay current without extra effort. For example, one Helios Technologies Narrative might assume a much higher Fair Value than another, which could lead those investors to reach very different conclusions about whether the recent US$64.05 price looks appealing or not.
Do you think there's more to the story for Helios Technologies? Head over to our Community to see what others are saying!
This article by Simply Wall St is general in nature. We provide commentary based on historical data and analyst forecasts only using an unbiased methodology and our articles are not intended to be financial advice. It does not constitute a recommendation to buy or sell any stock, and does not take account of your objectives, or your financial situation. We aim to bring you long-term focused analysis driven by fundamental data. Note that our analysis may not factor in the latest price-sensitive company announcements or qualitative material. Simply Wall St has no position in any stocks mentioned.
Have feedback on this article? Concerned about the content? Get in touch with us directly. Alternatively, email editorial-team@simplywallst.com