

Is California Water Service Group (CWT) Pricing Look Stretched After Recent Steady Share Performance
- If you are wondering whether California Water Service Group is reasonably priced or offering hidden value at around US$44.47 per share, this article walks through what the numbers are actually saying.
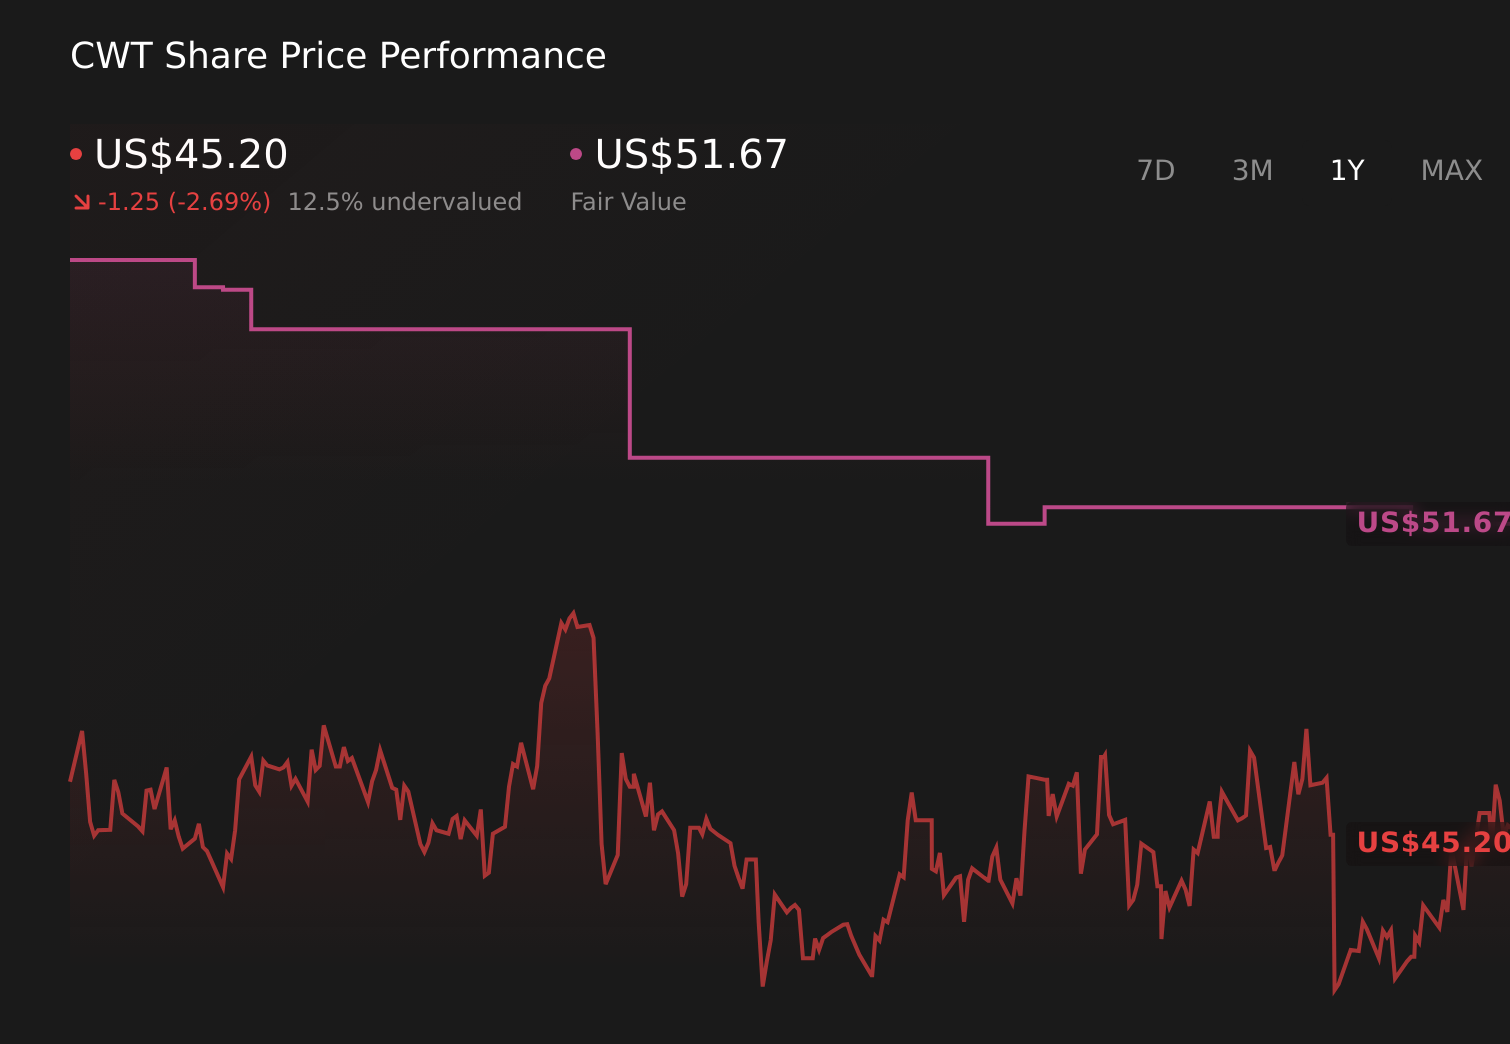
- The stock is roughly flat over the last week with a 1.2% decline, modestly positive over the past month at 2.1%, and up 3.5% year to date. However, the 3 year and 5 year returns of 25.5% and 12.2% declines hint at a mixed longer term experience.
- Recent coverage has focused on California Water Service Group as a regulated utility serving essential water needs, with attention on how investors weigh steady demand against interest rate moves and changing market sentiment toward utilities. This context helps explain why shorter term gains sit alongside weaker multi year returns as investors reassess the risk and return trade off for the sector.
- On our checklist of six valuation tests, California Water Service Group scores 1 out of 6 for being assessed as undervalued. We will compare different valuation methods next and then finish with a way of looking at value that ties them all together more clearly.
California Water Service Group scores just 1/6 on our valuation checks. See what other red flags we found in the full valuation breakdown.
Approach 1: California Water Service Group Dividend Discount Model (DDM) Analysis
The Dividend Discount Model looks at the cash you receive directly, the dividend, and estimates what that stream of payments might be worth today. It does this by projecting future dividends at a steady growth rate and discounting them back to the present.
For California Water Service Group, the model uses a current dividend per share of US$1.39, a return on equity of 8.15% and a payout ratio of about 53%. The long term dividend growth rate is capped at 3.26%, slightly below the 3.81% figure implied by the inputs, with an expected growth reference of 3.81%. This keeps the growth assumption relatively conservative and tied to what the company is already paying out.
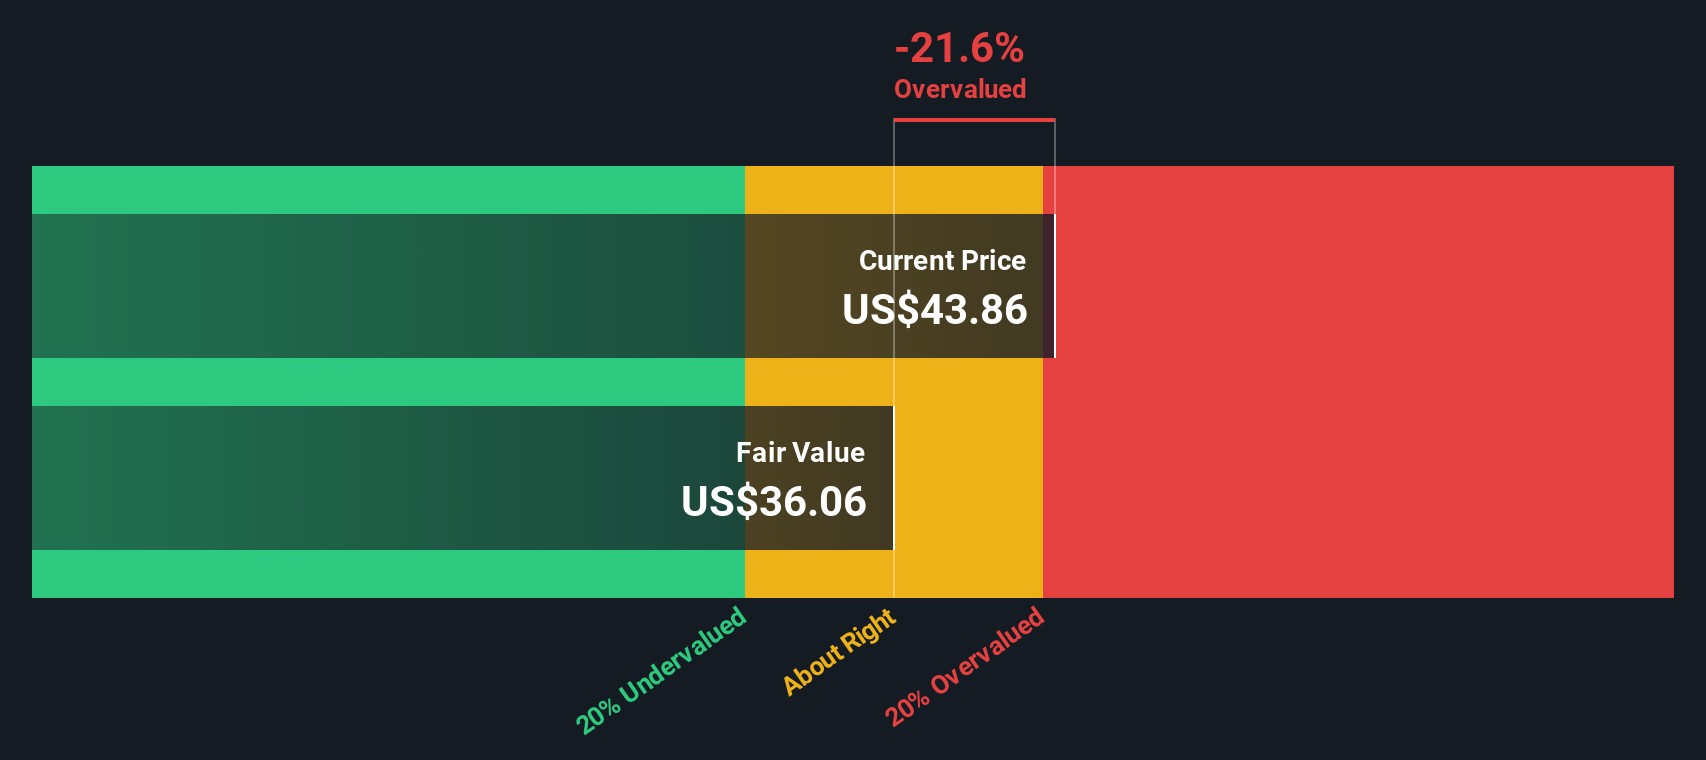
Putting these assumptions together gives an estimated intrinsic value of about US$37.52 per share. Compared with a recent share price of roughly US$44.47, the DDM output implies the stock is about 18.5% overvalued from this dividend-based perspective.
Result: OVERVALUED
Our Dividend Discount Model (DDM) analysis suggests California Water Service Group may be overvalued by 18.5%. Discover 869 undervalued stocks or create your own screener to find better value opportunities.
Approach 2: California Water Service Group Price vs Earnings
For a company that is generating profits, the P/E ratio is a straightforward way to think about what you are paying for each dollar of earnings. Investors usually accept a higher P/E if they expect stronger growth or see lower risk, and look for a lower P/E if growth expectations are modest or risks feel higher.
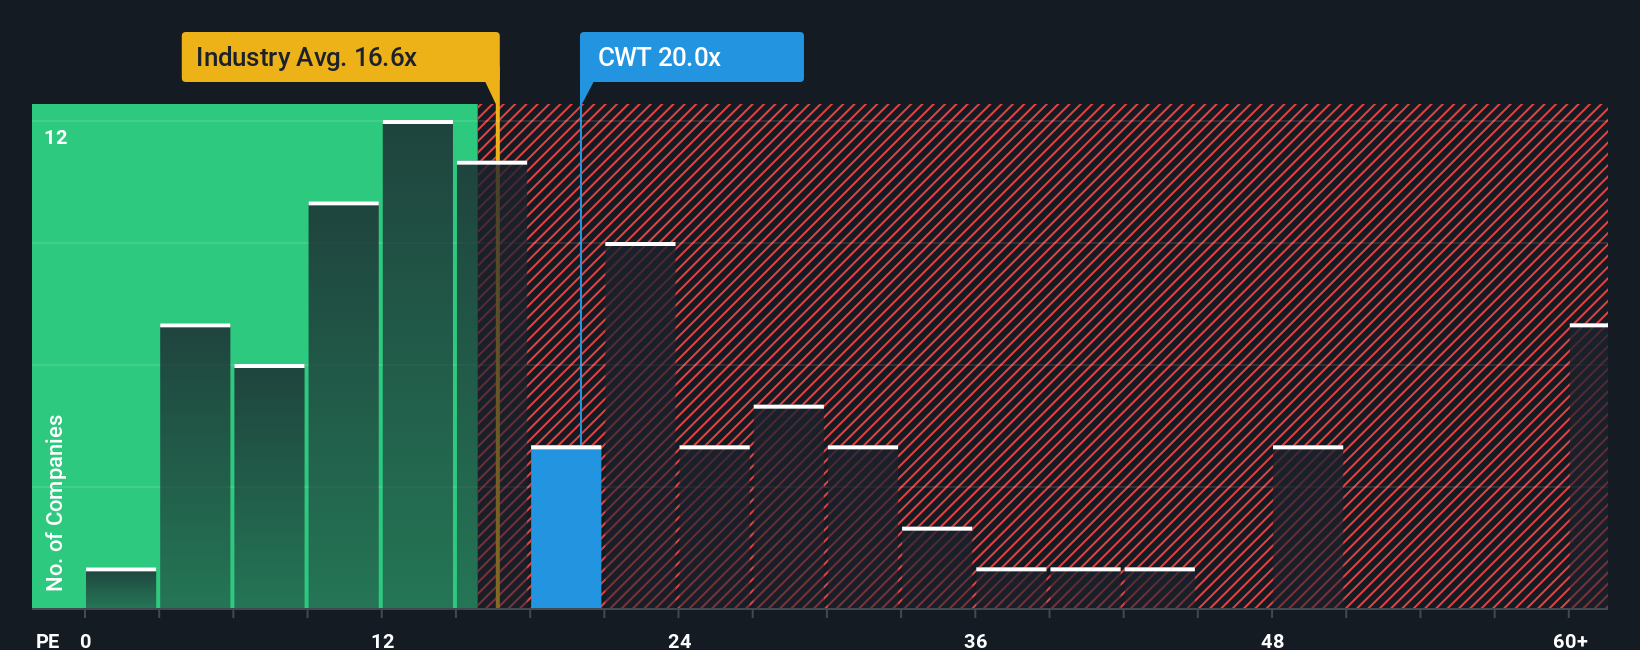
California Water Service Group currently trades on a P/E of 19.43x. That sits above the Water Utilities industry average of 16.39x, and below the peer group average of 23.83x, so the market is pricing it between the broader sector and closer peers.
Simply Wall St’s Fair Ratio of 17.34x is its estimate of what a more balanced P/E could look like for this stock, given factors such as earnings growth, industry, profit margins, market cap and risk profile. This tends to be more tailored than a simple comparison with industry or peers, which may have very different growth or risk characteristics. On this basis, California Water Service Group’s current P/E of 19.43x sits above the Fair Ratio. This indicates that the shares appear overvalued on this earnings multiple view.
Result: OVERVALUED
P/E ratios tell one story, but what if the real opportunity lies elsewhere? Discover 1417 companies where insiders are betting big on explosive growth.
Upgrade Your Decision Making: Choose your California Water Service Group Narrative
Earlier we mentioned that there is an even better way to understand valuation, so let us introduce you to Narratives, a simple way to connect your view of a company with the numbers behind it.
A Narrative is your story for California Water Service Group, where you spell out what you think happens to revenue, earnings and margins, which then flows through to an estimated fair value per share.
On Simply Wall St's Community page, millions of investors use Narratives as an accessible tool that links a company's story to a forecast and then to a fair value that can be compared with the current price to help decide whether they see it as an opportunity or something to avoid right now.
Narratives update when new information such as news or earnings is added. One investor might build a California Water Service Group Narrative that supports a higher fair value because they expect steadier earnings, while another might set a lower fair value because they assume more muted profitability and use a higher discount rate for their forecast.
Do you think there's more to the story for California Water Service Group? Head over to our Community to see what others are saying!
This article by Simply Wall St is general in nature. We provide commentary based on historical data and analyst forecasts only using an unbiased methodology and our articles are not intended to be financial advice. It does not constitute a recommendation to buy or sell any stock, and does not take account of your objectives, or your financial situation. We aim to bring you long-term focused analysis driven by fundamental data. Note that our analysis may not factor in the latest price-sensitive company announcements or qualitative material. Simply Wall St has no position in any stocks mentioned.
Have feedback on this article? Concerned about the content? Get in touch with us directly. Alternatively, email editorial-team@simplywallst.com