

Is It Time To Reassess First Horizon (FHN) After Its Recent Share Price Climb?
- If you are wondering whether First Horizon's current share price lines up with its underlying worth, you are not alone, and that is exactly what this article will unpack.
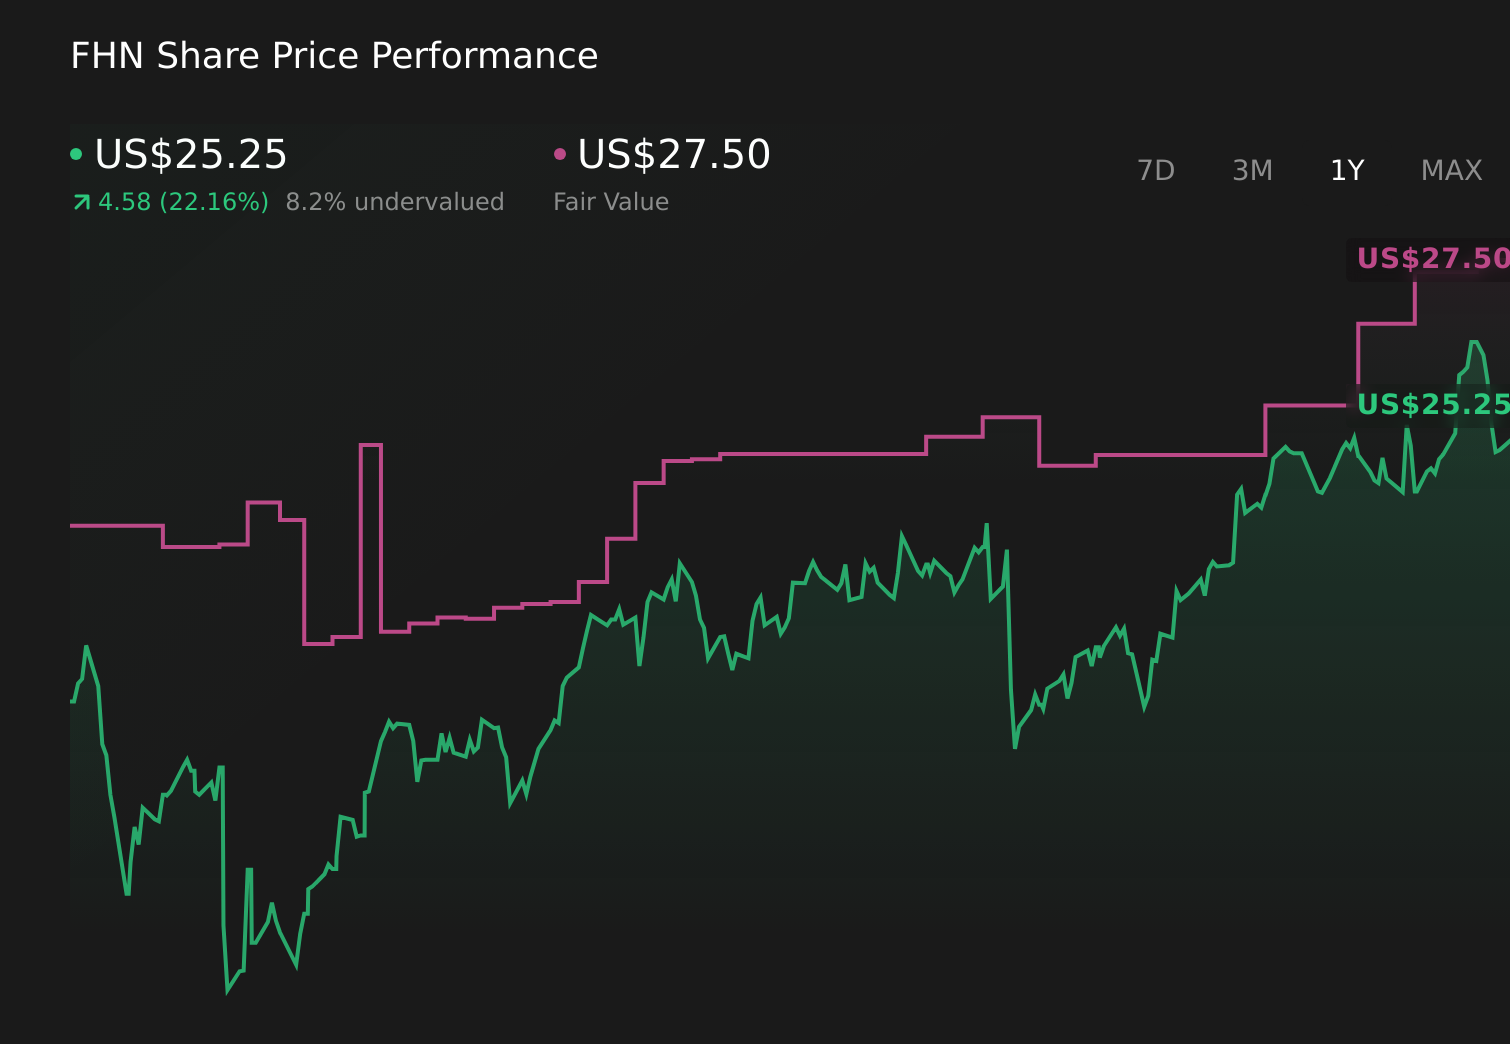
- The stock most recently closed at US$24.42, with returns of 1.2% year to date and 14.5% over the last year. Over the past 5 years it shows a 91.2% return, with a 7 day move of a 0.9% decline and a 30 day return of 2.1%.
- Recent coverage around First Horizon has focused on its position within the US regional banking sector and how investors are weighing bank specific risks against broader financial sector sentiment. This has framed recent price moves as part of a wider reassessment of risk and value across bank stocks.
- Simply Wall St currently gives First Horizon a valuation score of 4 out of 6, which means it screens as undervalued on four of six checks. Next we will look at how traditional valuation tools line up with that score before turning to a more complete way of thinking about value at the end of the article.
Find out why First Horizon's 14.5% return over the last year is lagging behind its peers.
Approach 1: First Horizon Excess Returns Analysis
The Excess Returns model looks at how much value First Horizon can create above the return that shareholders are assumed to require. Instead of focusing on cash flows, it weighs the earnings the bank can generate on its equity against the cost of that equity.
For First Horizon, book value is $17.52 per share and the stable earnings figure used in the model is $2.33 per share, based on weighted future Return on Equity estimates from 11 analysts. The average Return on Equity used is 11.92%, while the cost of equity is $1.36 per share. That leaves an excess return of $0.97 per share, which is what this model treats as value created beyond the required return.
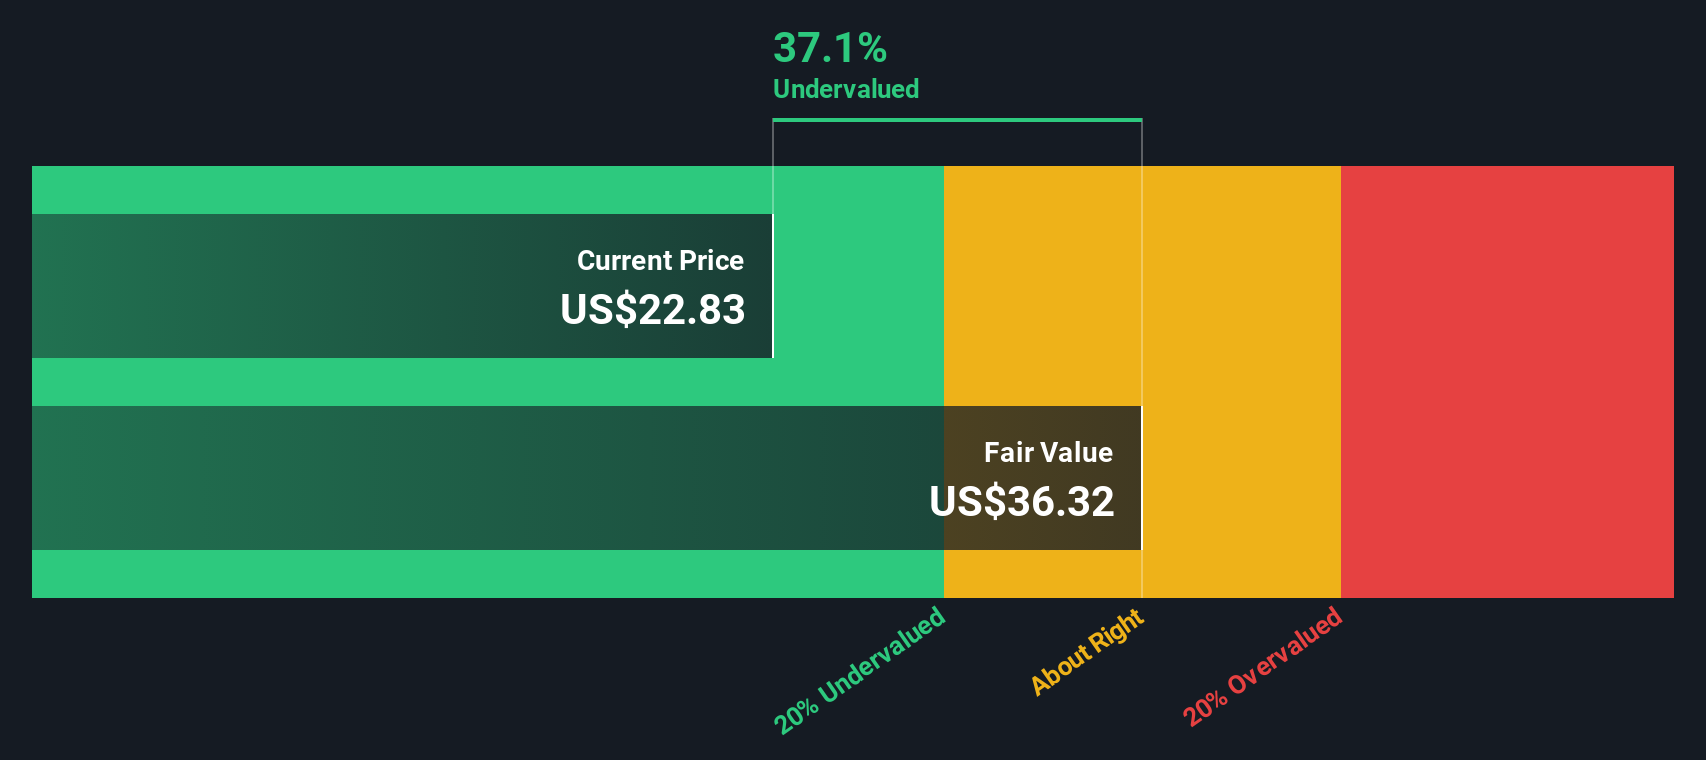
The analysis also assumes a stable book value of $19.55 per share, sourced from weighted future book value estimates from 12 analysts. Combining these inputs, the Excess Returns model arrives at an intrinsic value estimate of about $45.68 per share. Compared with the recent share price of US$24.42, this implies the stock screens as 46.5% undervalued under this approach.
Result: UNDERVALUED
Our Excess Returns analysis suggests First Horizon is undervalued by 46.5%. Track this in your watchlist or portfolio, or discover 869 more undervalued stocks based on cash flows.
Approach 2: First Horizon Price vs Earnings
P/E is a common way to look at profitable companies because it links what you pay per share to the earnings that each share generates. If investors expect steadier earnings or lower risk, they may be comfortable with a higher P/E, while weaker growth expectations or higher perceived risk usually line up with a lower P/E being seen as normal.
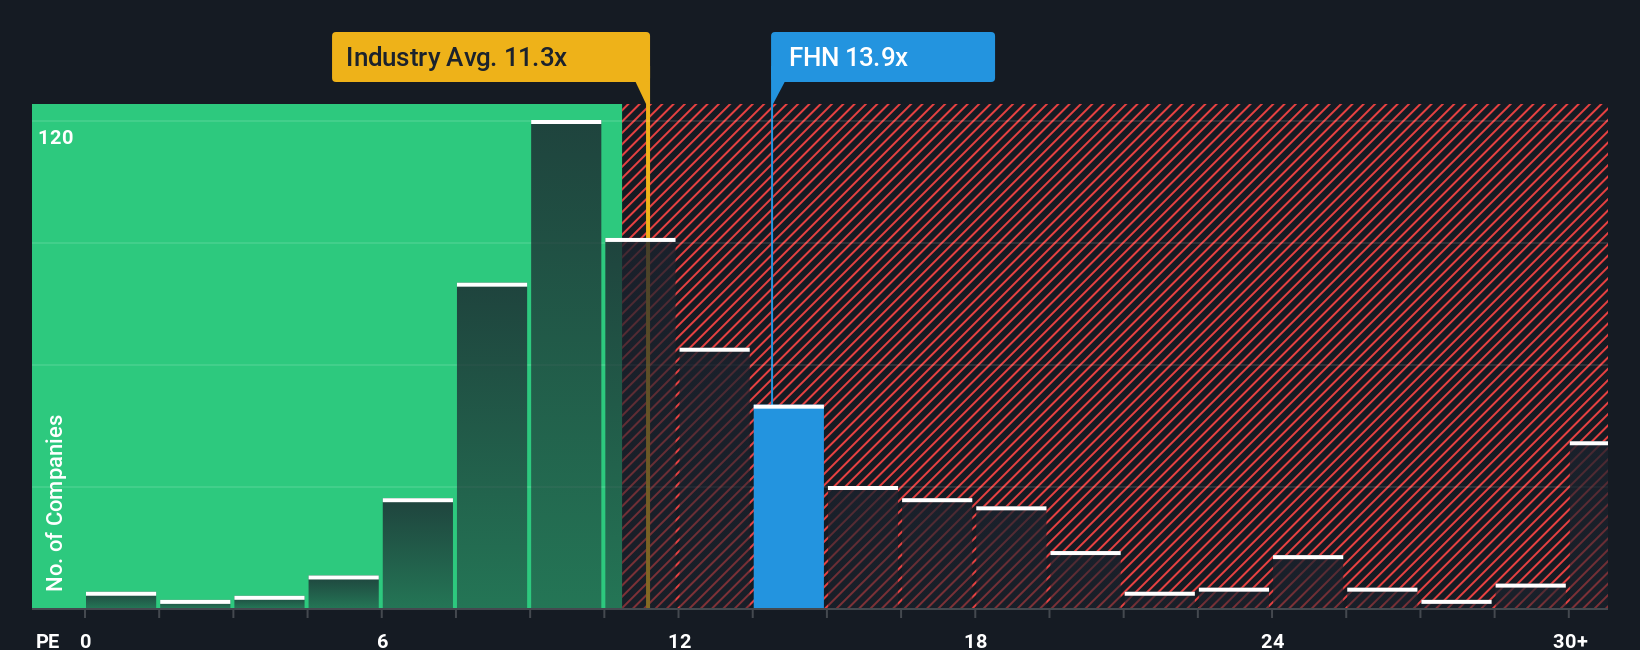
First Horizon currently trades on a P/E of 12.39x. That sits above the Banks industry average of 11.79x, but below the peer group average of 13.84x. Simply Wall St also calculates a Fair Ratio of 12.97x for First Horizon. This Fair Ratio is a proprietary estimate of what a reasonable P/E could look like for this specific company, based on factors such as its earnings profile, industry, profit margins, market value and risk characteristics.
Compared with a simple industry or peer comparison, the Fair Ratio aims to be more tailored to First Horizon, since it folds in growth characteristics, risk, profitability, sector and company size rather than just averaging other banks. With the current P/E at 12.39x versus a Fair Ratio of 12.97x, the stock screens as slightly undervalued on this measure.
Result: UNDERVALUED
P/E ratios tell one story, but what if the real opportunity lies elsewhere? Discover 1418 companies where insiders are betting big on explosive growth.
Upgrade Your Decision Making: Choose your First Horizon Narrative
Earlier we mentioned that there is an even better way to understand valuation, so let us introduce you to Narratives, which are simply the story you believe about a company, linked directly to your own forecast and fair value estimate.
On Simply Wall St's Community page, investors use Narratives to set their assumptions for future revenue, earnings and margins. They then connect those forecasts to a fair value that can be compared with the current share price to help decide whether it might be a time to buy, hold or sell.
Because Narratives sit on top of real numbers and update when fresh information such as news or earnings arrives, your view of First Horizon can adjust in step with new data instead of staying fixed to a single historical snapshot.
For example, one First Horizon Narrative might assume a relatively cautious outlook and arrive at a fair value close to the current US$24.42 price. Another more optimistic Narrative could use stronger earnings assumptions that support a fair value closer to the Excess Returns estimate of about US$45.68.
Do you think there's more to the story for First Horizon? Head over to our Community to see what others are saying!
This article by Simply Wall St is general in nature. We provide commentary based on historical data and analyst forecasts only using an unbiased methodology and our articles are not intended to be financial advice. It does not constitute a recommendation to buy or sell any stock, and does not take account of your objectives, or your financial situation. We aim to bring you long-term focused analysis driven by fundamental data. Note that our analysis may not factor in the latest price-sensitive company announcements or qualitative material. Simply Wall St has no position in any stocks mentioned.
Have feedback on this article? Concerned about the content? Get in touch with us directly. Alternatively, email editorial-team@simplywallst.com