

Is Owens Corning (OC) Attractive After Recent Share Price Slide And DCF Assessment
- If you are wondering whether Owens Corning shares are offering good value today, it helps to first line up the recent price moves with what the underlying estimates and balance sheet are telling you.
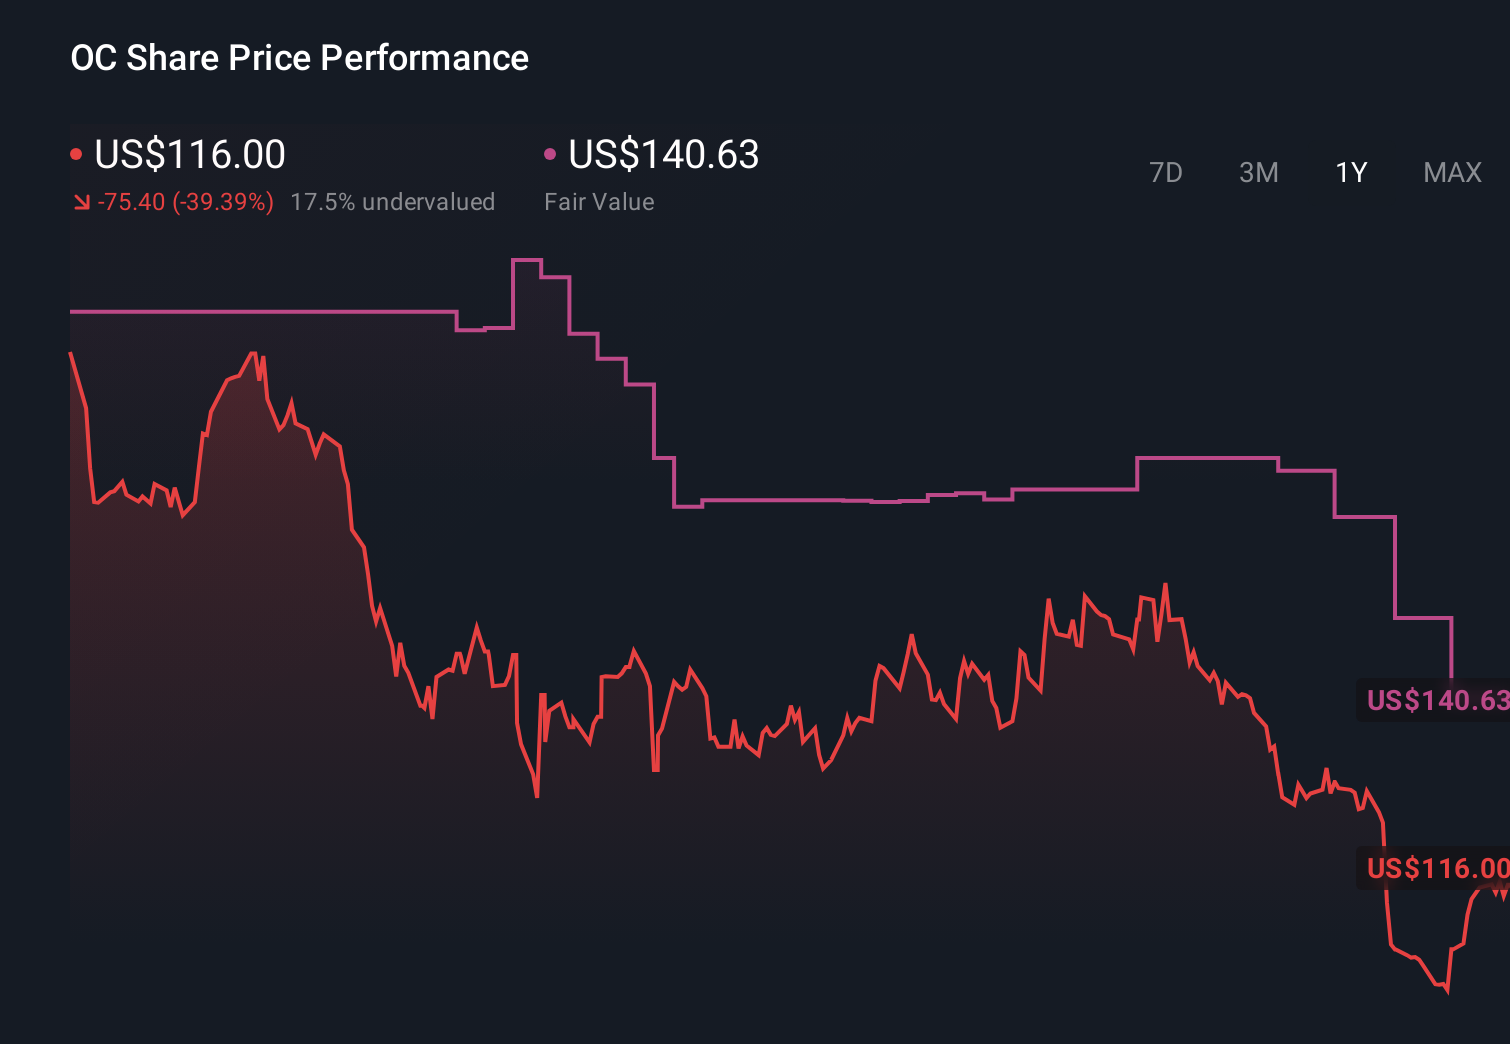
- The stock last closed at US$119.84, with returns of 7.1% over the past 30 days, 5.0% year to date, a 33.6% decline over the last year, and gains of 25.3% and 58.8% over the past 3 and 5 years respectively. This performance may leave you questioning whether the current price still reflects earlier expectations or a shift in risk appetite.
- Recent news coverage around Owens Corning has focused more on its role as a key building products supplier and how housing and construction trends can influence sentiment on the stock, rather than on one single company specific event. That context helps explain why the share price can move in bursts as investors reassess how sensitive the business might be to changes in construction activity or broader market conditions.
- Simply Wall St currently gives Owens Corning a valuation score of 4/6, which means it screens as undervalued on four of six checks. Next, we will look at what different valuation methods say about that score before finishing with a more holistic way to think about what the stock could be worth over time.
Find out why Owens Corning's -33.6% return over the last year is lagging behind its peers.
Approach 1: Owens Corning Discounted Cash Flow (DCF) Analysis
A Discounted Cash Flow, or DCF, model estimates what a business could be worth by projecting its future cash flows and then discounting those back into today’s dollars. It is essentially asking what all the future cash the company might generate is worth right now.
For Owens Corning, the latest twelve month free cash flow stands at about $1.16b. Analysts provide explicit forecasts for the next few years, and Simply Wall St then extends those estimates further out. In this case, projected free cash flow in 2027 is $923.16m, with additional estimates running through to 2035, all expressed in $ and discounted using a 2 Stage Free Cash Flow to Equity model.
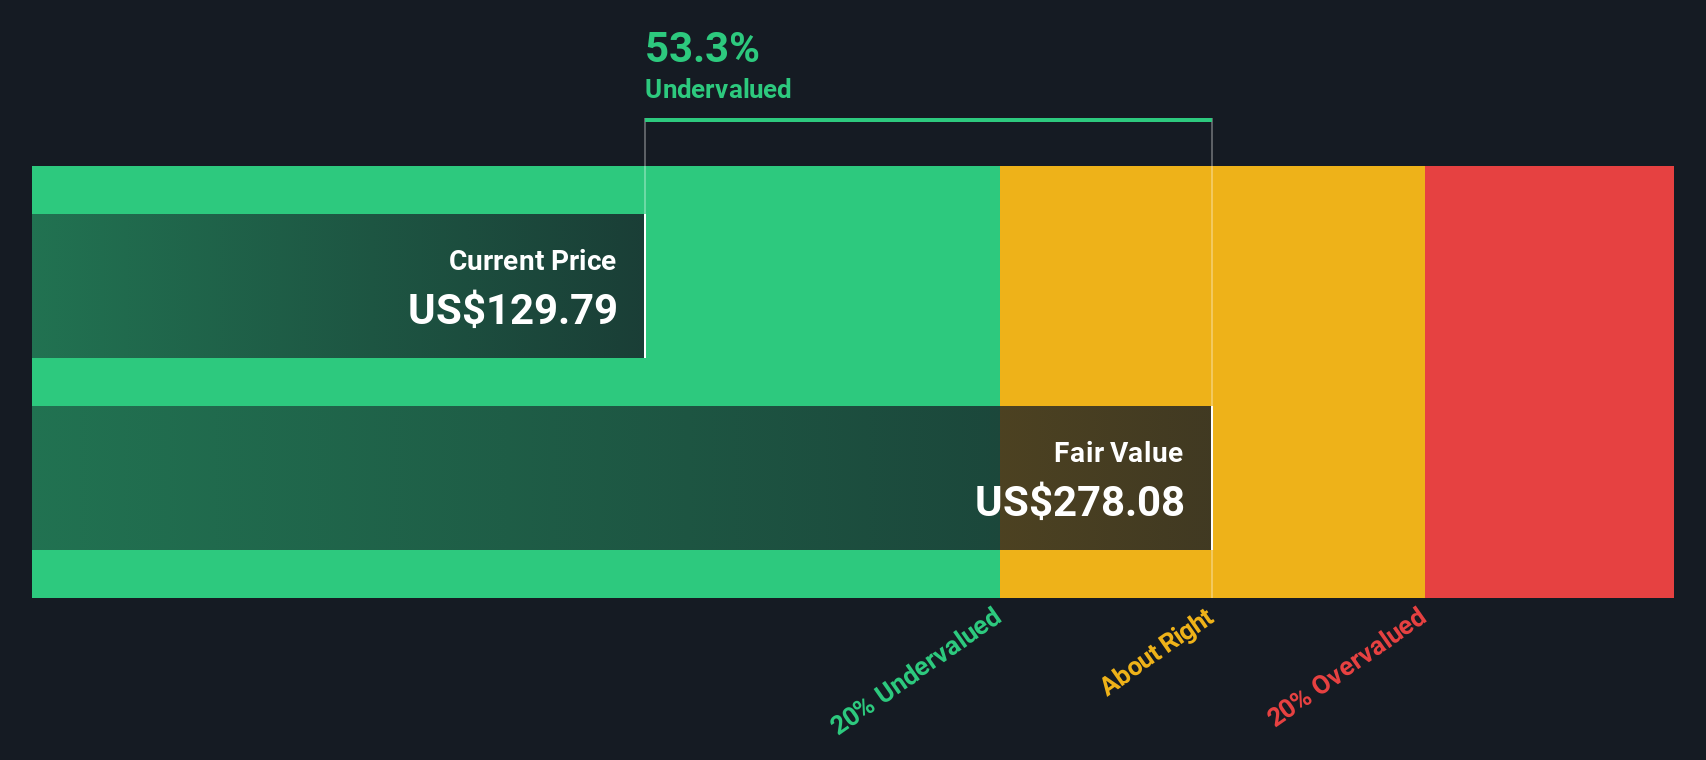
Putting those cash flow projections together, the DCF model arrives at an estimated intrinsic value of about $127.47 per share. Compared with the recent share price of $119.84, this implies the stock is around 6.0% undervalued on this method, which is a relatively small gap.
Result: ABOUT RIGHT
Owens Corning is fairly valued according to our Discounted Cash Flow (DCF), but this can change at a moment's notice. Track the value in your watchlist or portfolio and be alerted on when to act.
Approach 2: Owens Corning Price vs Sales
For a company like Owens Corning, where revenue is a key anchor for how investors think about the business, the price to sales ratio is a useful cross check on valuation. It links the market value of the company directly to the dollars of sales it generates, which can be helpful when earnings are less straightforward to interpret.
What investors usually see as a normal P/S ratio depends on how confident the market is about future growth and how risky those cash flows appear. Higher expected growth or lower perceived risk can justify a higher multiple, while slower growth or higher uncertainty tends to pull that multiple down.
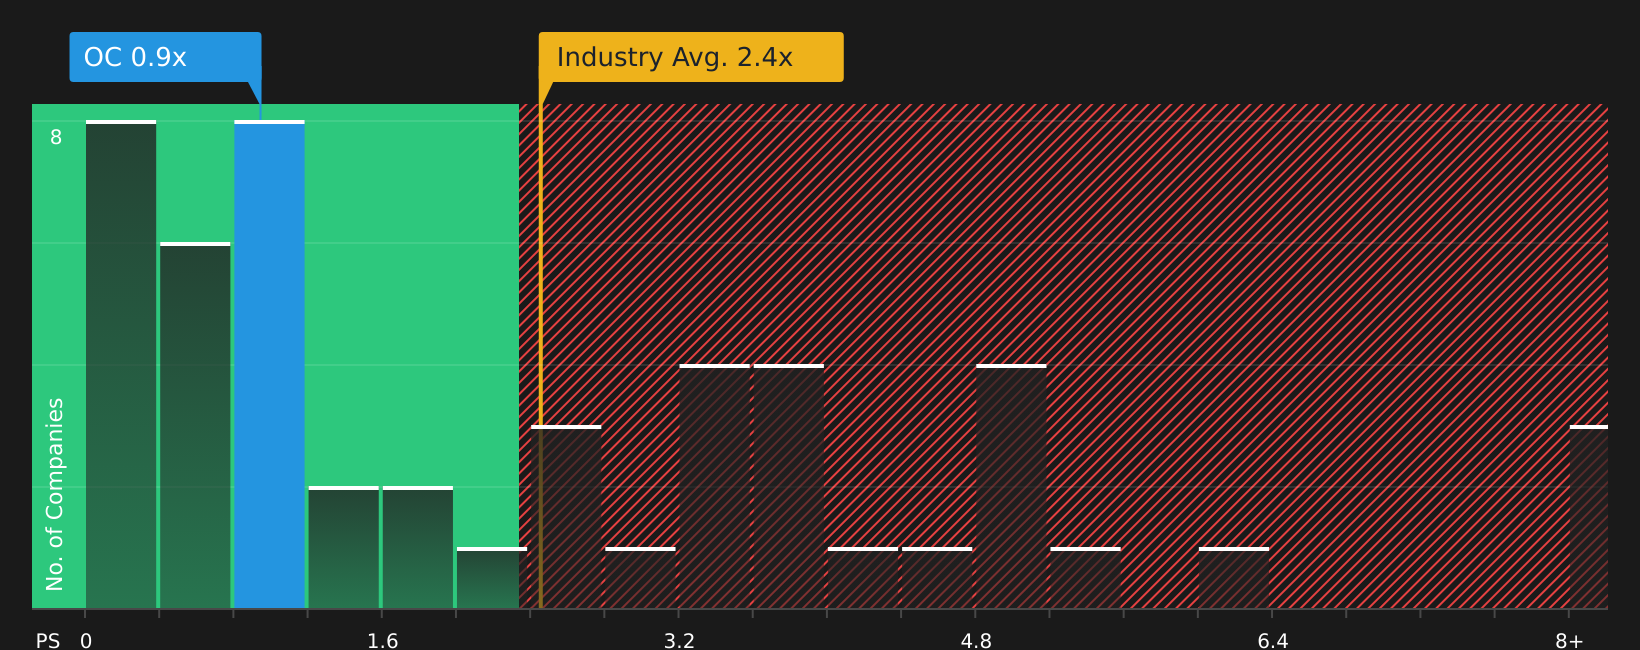
Owens Corning currently trades on a P/S of 0.84x, compared with the Building industry average of 1.90x and a peer group average of 3.97x. Simply Wall St’s Fair Ratio for the stock is 1.22x. This is its proprietary view of what a reasonable P/S could be after considering factors such as earnings growth outlook, industry, profit margins, market capitalization and key risks. This Fair Ratio can be more useful than a simple peer or industry comparison because it adjusts for differences in business quality and risk profile. On this measure, the current 0.84x P/S sits below the 1.22x Fair Ratio, which indicates that the shares may be undervalued on the P/S approach.
Result: UNDERVALUED
P/S ratios tell one story, but what if the real opportunity lies elsewhere? Discover 1417 companies where insiders are betting big on explosive growth.
Upgrade Your Decision Making: Choose your Owens Corning Narrative
Earlier we mentioned that there is an even better way to understand valuation, so let us introduce you to Narratives, which are simply your story about a company linked directly to your assumptions for fair value, future revenue, earnings and margins.
On Simply Wall St, Narratives live inside the Community page and give you an easy way to connect what you believe about Owens Corning with a financial forecast and then a fair value that you can compare with the current share price to help you decide how you view the stock.
Because Narratives on the platform update automatically when new information such as earnings releases or company news is added, your view stays aligned with what is happening without you having to rebuild your numbers from scratch each time.
For Owens Corning, one investor might build a Narrative that sees a relatively cautious fair value, while another might set a higher fair value based on a more optimistic view of margins and construction activity. Simply Wall St lets you see and compare both stories side by side.
Do you think there's more to the story for Owens Corning? Head over to our Community to see what others are saying!
This article by Simply Wall St is general in nature. We provide commentary based on historical data and analyst forecasts only using an unbiased methodology and our articles are not intended to be financial advice. It does not constitute a recommendation to buy or sell any stock, and does not take account of your objectives, or your financial situation. We aim to bring you long-term focused analysis driven by fundamental data. Note that our analysis may not factor in the latest price-sensitive company announcements or qualitative material. Simply Wall St has no position in any stocks mentioned.
Have feedback on this article? Concerned about the content? Get in touch with us directly. Alternatively, email editorial-team@simplywallst.com