

Evaluating OUTFRONT Media (OUT) After A 47% One-Year Rally
- If you are wondering whether OUTFRONT Media is still reasonably priced after its recent run, this article walks through what the current share price could imply about value.
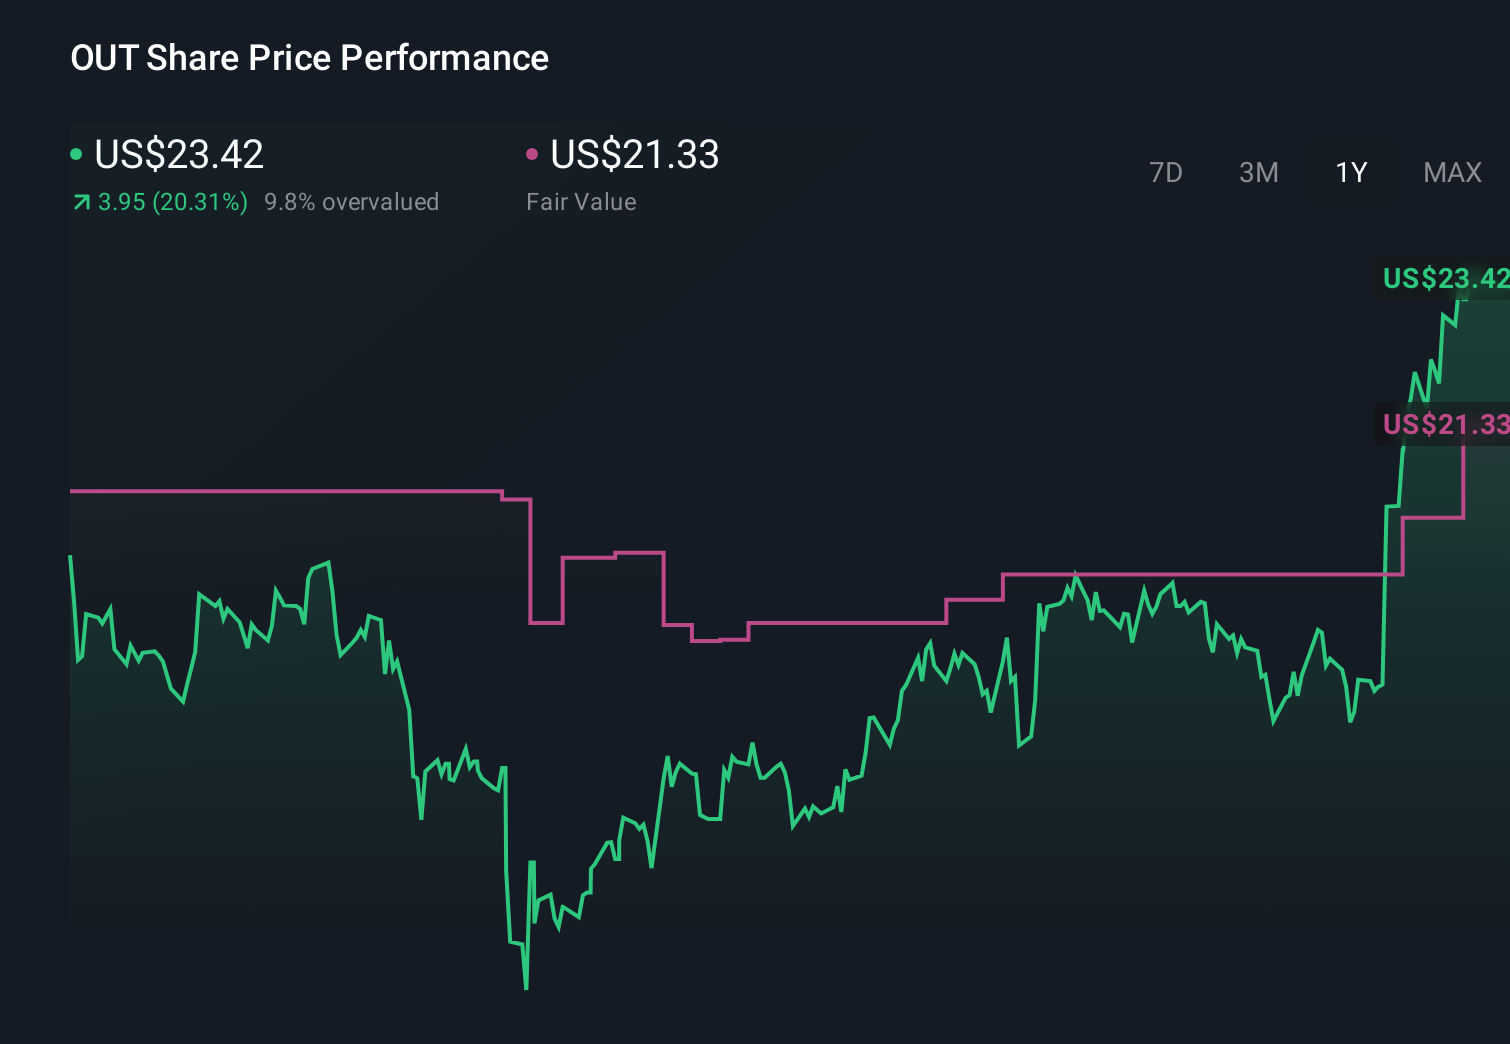
- The stock last closed at US$25.23, with returns of 3.2% over 7 days, 6.4% over 30 days, 6.4% year to date, 47.5% over 1 year, 53.3% over 3 years, and 58.1% over 5 years.
- Those moves sit against a backdrop of ongoing interest in the company as an outdoor advertising REIT and continuing coverage in the financial press that keeps investor attention on how the business is positioned within the broader real estate and media space. This mix of performance data and ongoing commentary has prompted many investors to reassess what they are really paying for at today's price.
- On our framework, OUTFRONT Media scores a valuation check of 3 out of 6. This means half of the tests flag the shares as undervalued. We will walk through what different valuation methods say about that score and then finish with a more complete way to think about value beyond the headline metrics.
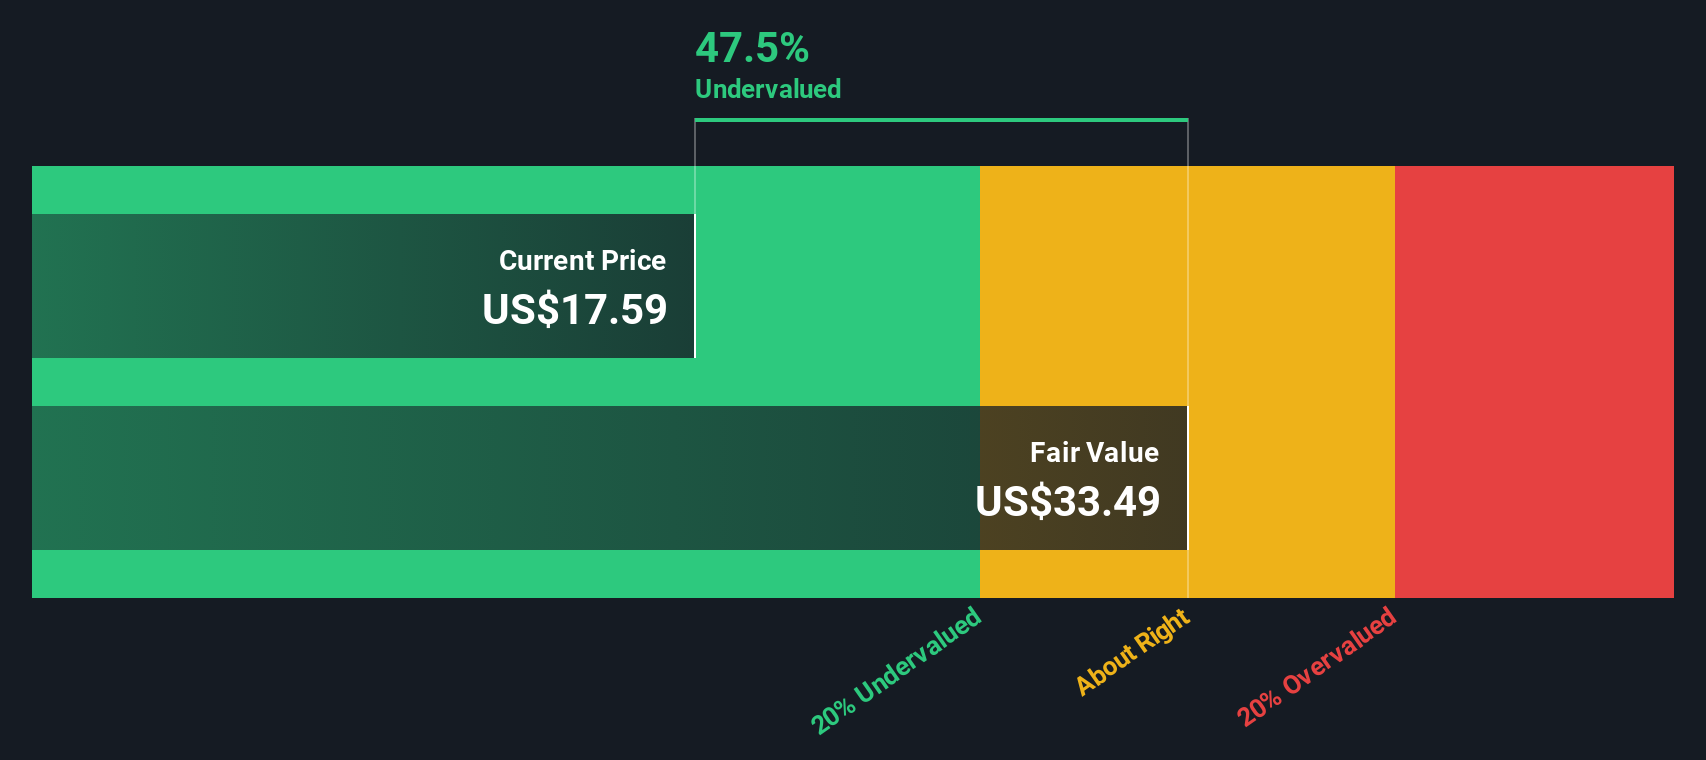
Approach 1: OUTFRONT Media Discounted Cash Flow (DCF) Analysis
A DCF model estimates what a company might be worth by projecting its future adjusted funds from operations, then discounting those cash flows back to today in dollar terms. For OUTFRONT Media, the model uses a two-stage Free Cash Flow to Equity approach based on adjusted funds from operations.
The latest twelve-month free cash flow is US$307.5 million. Analyst inputs and extrapolated estimates project free cash flow of US$365.1 million in 2026 and US$384.4 million in 2027, with further projections by Simply Wall St reaching US$542.3 million in 2035. All of these remain under US$1 billion, so they are considered in millions throughout the model.
Discounting this ten-year stream of projected cash flows, and incorporating a terminal value, produces an estimated intrinsic value of US$40.60 per share. Compared with the recent share price of US$25.23, the model indicates a 37.9% discount, which points to OUTFRONT Media trading below this DCF-based estimate.
Result: UNDERVALUED
Our Discounted Cash Flow (DCF) analysis suggests OUTFRONT Media is undervalued by 37.9%. Track this in your watchlist or portfolio, or discover 876 more undervalued stocks based on cash flows.
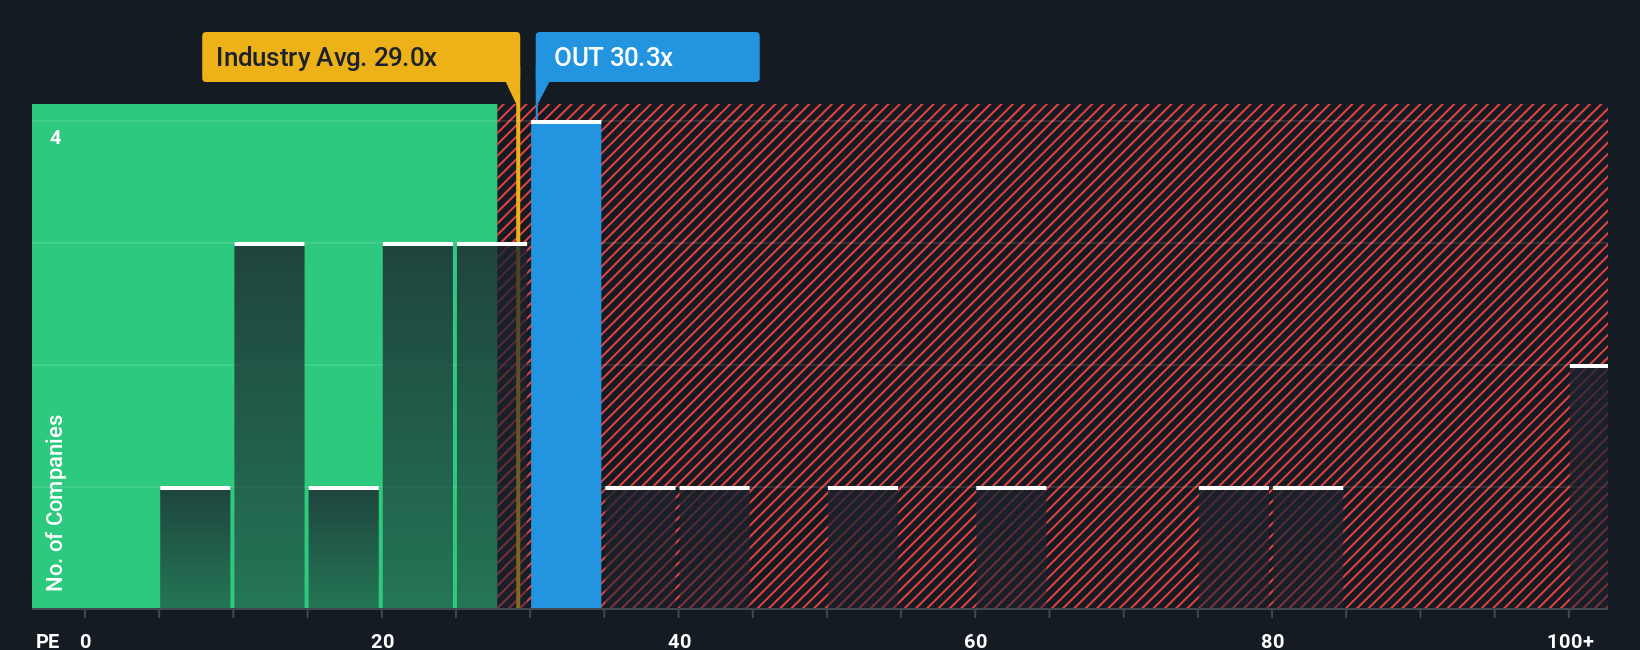
Approach 2: OUTFRONT Media Price vs Earnings
For a profitable company like OUTFRONT Media, the P/E ratio is a useful way to think about what you are paying for each dollar of earnings. Investors typically accept a higher P/E when they expect stronger earnings growth or view the business as lower risk, and a lower P/E when growth prospects or risk look less favorable.
OUTFRONT Media currently trades on a P/E of 36.6x. That sits above the Specialized REITs industry average of 16.3x and also above the peer group average of 23.3x, so the stock is priced at a higher earnings multiple than many of its closest comparables.
Simply Wall St also calculates a “Fair Ratio” of 46.4x for OUTFRONT Media. This proprietary figure estimates what a reasonable P/E could be after accounting for factors such as the company’s earnings growth profile, its industry, profit margins, market capitalization and company specific risks. Because it adjusts for these elements, the Fair Ratio can be more informative than a simple comparison with industry or peers.
With the current P/E of 36.6x sitting below the Fair Ratio of 46.4x, the shares screen as undervalued on this earnings based approach.
Result: UNDERVALUED
P/E ratios tell one story, but what if the real opportunity lies elsewhere? Discover 1424 companies where insiders are betting big on explosive growth.
Upgrade Your Decision Making: Choose your OUTFRONT Media Narrative
Earlier we mentioned that there is an even better way to think about valuation, so let us introduce Narratives, a simple way for you to spell out the story you see for OUTFRONT Media, link it to your own assumptions for future revenue, earnings and margins, and then connect that story to a clear fair value estimate.
A Narrative on Simply Wall St’s Community page lets you combine your view of the business, your financial forecast and a fair value in one place, so you can easily compare that Fair Value to the current share price when deciding whether the stock looks attractive or expensive to you.
Because Narratives are updated when new information such as news or earnings is added to the platform, they help you keep your story and numbers aligned without needing to rebuild a full model each time something changes.
For example, one OUTFRONT Media Narrative might assume a higher fair value based on stronger margin and revenue expectations. Another Narrative might set a lower fair value using more conservative revenue growth and profitability assumptions.
Do you think there's more to the story for OUTFRONT Media? Head over to our Community to see what others are saying!
This article by Simply Wall St is general in nature. We provide commentary based on historical data and analyst forecasts only using an unbiased methodology and our articles are not intended to be financial advice. It does not constitute a recommendation to buy or sell any stock, and does not take account of your objectives, or your financial situation. We aim to bring you long-term focused analysis driven by fundamental data. Note that our analysis may not factor in the latest price-sensitive company announcements or qualitative material. Simply Wall St has no position in any stocks mentioned.
Have feedback on this article? Concerned about the content? Get in touch with us directly. Alternatively, email editorial-team@simplywallst.com