

Is Old Second Bancorp (OSBC) Pricing Reflect Its Strong Excess Returns Potential
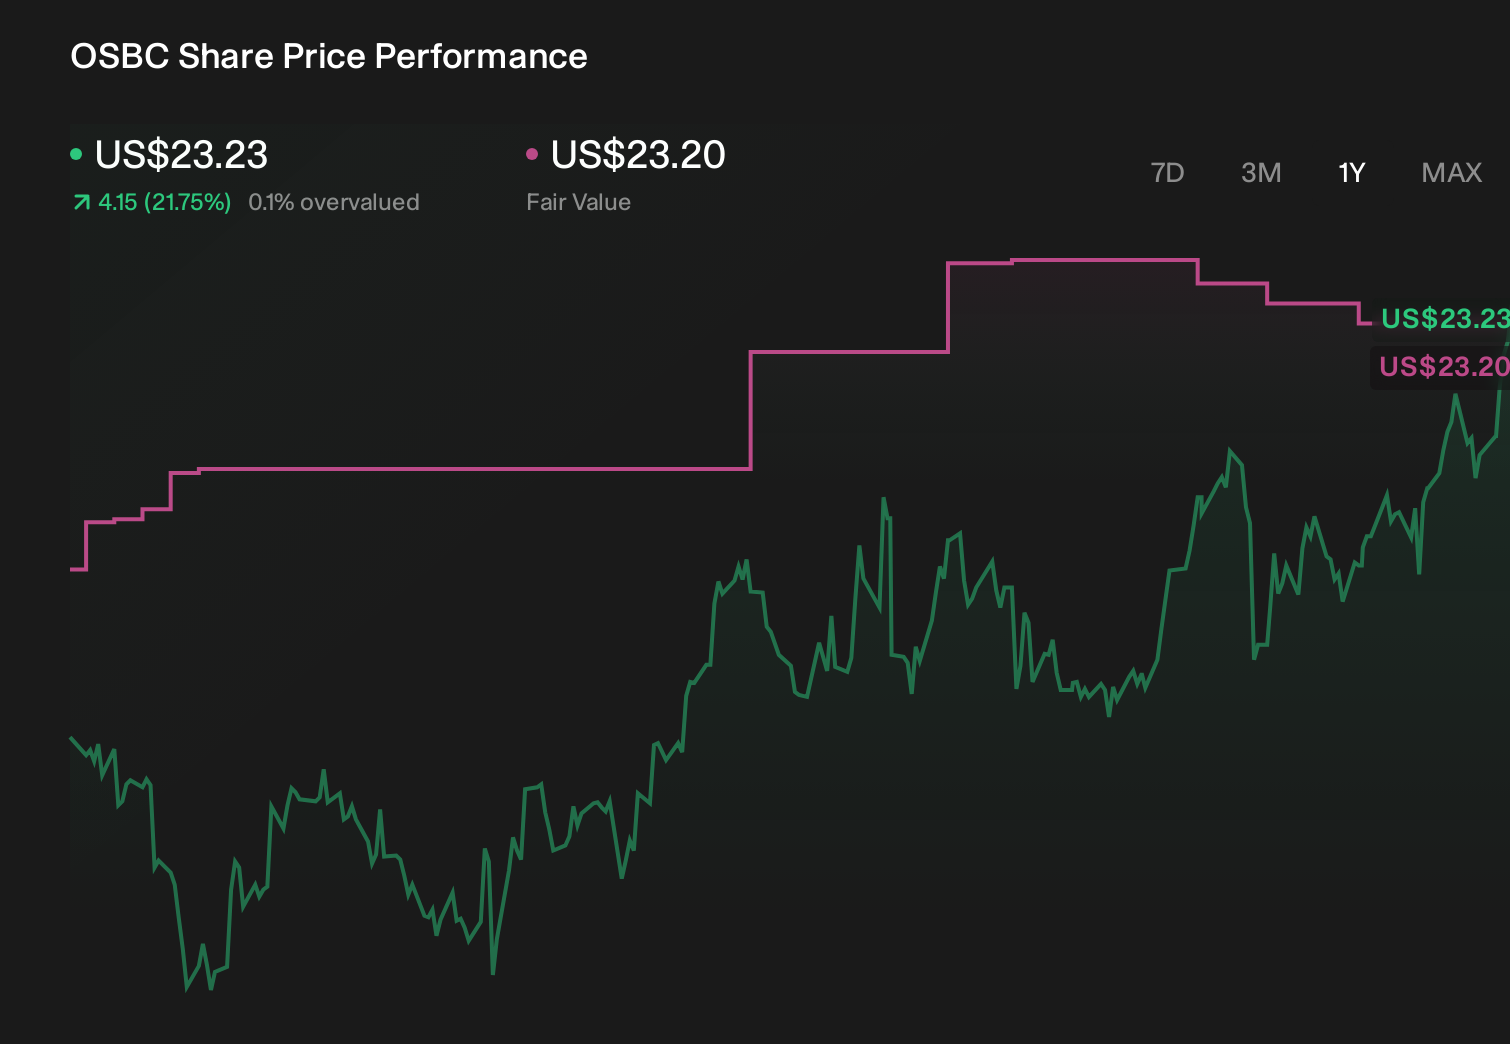
- If you are wondering whether Old Second Bancorp at around US$20.24 is offering fair value or a potential bargain, you are in the right place for a clear, valuation focused look at the stock.
- The share price sits at US$20.24 after returns of 1.8% over the last 7 days, 3.9% over the last 30 days, 3.9% year to date, 10.1% over 1 year and 22.4% over 3 years, with a 5 year return of 89.8%.
- Recent attention on Old Second Bancorp has been shaped by ongoing sector wide conversations around funding costs, loan growth and credit quality. These can shift how investors think about risk in regional banks. Broader news on regulation and interest rate expectations has also been in focus, providing additional context to the recent price moves.
- On our checks, Old Second Bancorp scores 3 out of 6 on valuation, as shown by our valuation score. Next, we will look at how traditional multiples and cash flow approaches line up, before finishing with a more practical way to think about what the valuation really means for you.
Find out why Old Second Bancorp's 10.1% return over the last year is lagging behind its peers.
Approach 1: Old Second Bancorp Excess Returns Analysis
The Excess Returns model looks at how much profit a bank can generate above the return that equity investors typically require, then capitalizes those extra profits into a per share value.
For Old Second Bancorp, the model starts with a Book Value of US$17.03 per share and a Stable EPS estimate of US$2.35 per share, based on weighted future Return on Equity estimates from 4 analysts. The implied Cost of Equity is US$1.40 per share, so the Excess Return comes out at US$0.95 per share. That reflects an Average Return on Equity of 11.70% on a Stable Book Value of US$20.07 per share, which is based on weighted future Book Value estimates from 5 analysts.
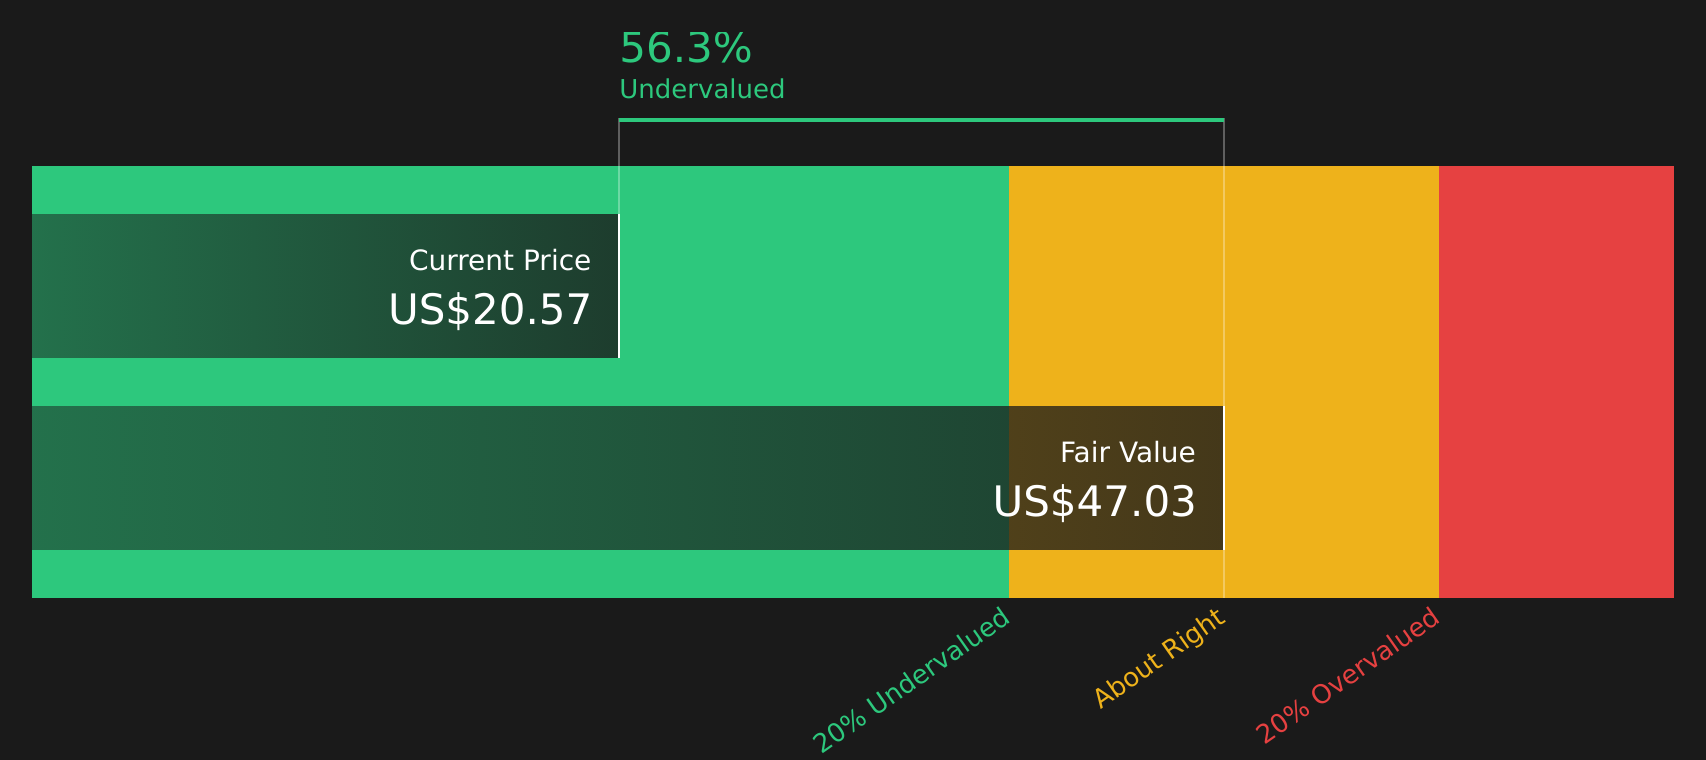
When these excess returns are projected and discounted, the Excess Returns model arrives at an intrinsic value of about US$45.83 per share. Compared with the current share price of around US$20.24, this implies the stock is 55.8% undervalued on this approach.
Result: UNDERVALUED
Our Excess Returns analysis suggests Old Second Bancorp is undervalued by 55.8%. Track this in your watchlist or portfolio, or discover 876 more undervalued stocks based on cash flows.
Approach 2: Old Second Bancorp Price vs Earnings
P/E is a common way to value profitable banks because it relates what you pay directly to the earnings the business is already generating. It is a simple way to see how much the market is willing to pay for each dollar of profit.
The “right” P/E for a stock usually reflects a mix of earnings growth expectations and perceived risk. Higher expected growth or lower perceived risk can support a higher multiple, while lower growth or higher risk often line up with a lower “normal” P/E.
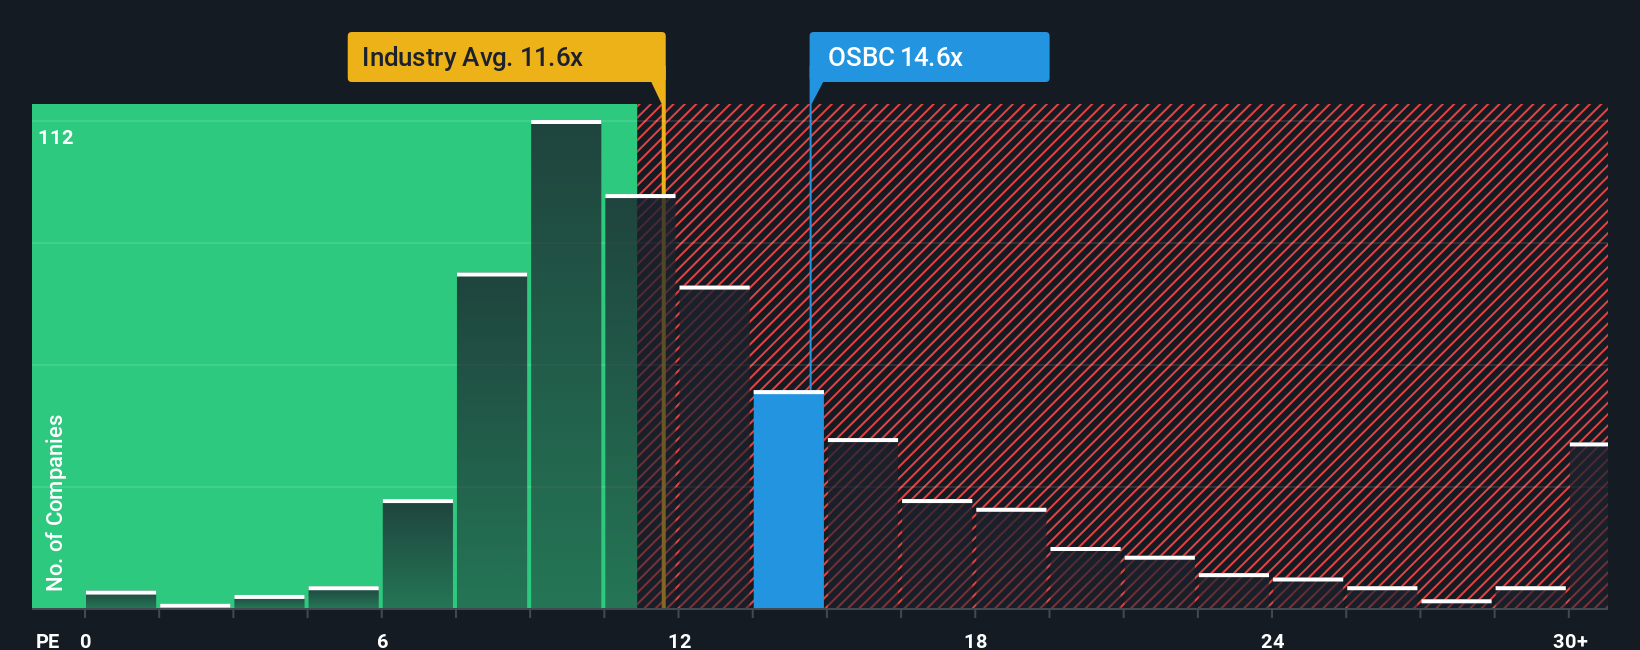
Old Second Bancorp is trading on a P/E of 13.27x. That sits above the Banks industry average P/E of 11.81x and the peer average of 9.59x. Simply Wall St’s Fair Ratio for Old Second Bancorp is 13.30x, which is a proprietary estimate of the P/E the stock might warrant given factors such as its earnings profile, industry, profit margins, size and risk characteristics.
The Fair Ratio is more tailored than a simple peer or industry comparison because it adjusts for company specific features rather than assuming all banks deserve the same multiple. With the current P/E of 13.27x sitting very close to the Fair Ratio of 13.30x, the shares appear broadly in line with this metric.
Result: ABOUT RIGHT
P/E ratios tell one story, but what if the real opportunity lies elsewhere? Discover 1424 companies where insiders are betting big on explosive growth.
Upgrade Your Decision Making: Choose your Old Second Bancorp Narrative
Earlier we mentioned that there is an even better way to understand valuation, so let us introduce you to Narratives, which are simply your story about a company linked directly to your numbers such as fair value and your expectations for future revenue, earnings and margins.
A Narrative connects what you believe about a business to a financial forecast, then ties that forecast to a fair value that you can compare to the current share price. On Simply Wall St, you can build and explore these Narratives on the Community page, where millions of investors share how they see companies like Old Second Bancorp. Narratives help you decide whether to act or wait by showing when your estimated fair value is above or below the current price, and they update automatically when fresh news, earnings or other data arrive. You might see one Old Second Bancorp Narrative that assumes very cautious revenue growth and a lower fair value, while another assumes steadier growth and a higher fair value. This gives you a clear view of how different assumptions lead to different conclusions.
Do you think there's more to the story for Old Second Bancorp? Head over to our Community to see what others are saying!
This article by Simply Wall St is general in nature. We provide commentary based on historical data and analyst forecasts only using an unbiased methodology and our articles are not intended to be financial advice. It does not constitute a recommendation to buy or sell any stock, and does not take account of your objectives, or your financial situation. We aim to bring you long-term focused analysis driven by fundamental data. Note that our analysis may not factor in the latest price-sensitive company announcements or qualitative material. Simply Wall St has no position in any stocks mentioned.
Have feedback on this article? Concerned about the content? Get in touch with us directly. Alternatively, email editorial-team@simplywallst.com