

Assessing Dorchester Minerals (DMLP) Valuation After Recent Price Strength And Earnings Weakness
Why Dorchester Minerals is on income investors’ radar
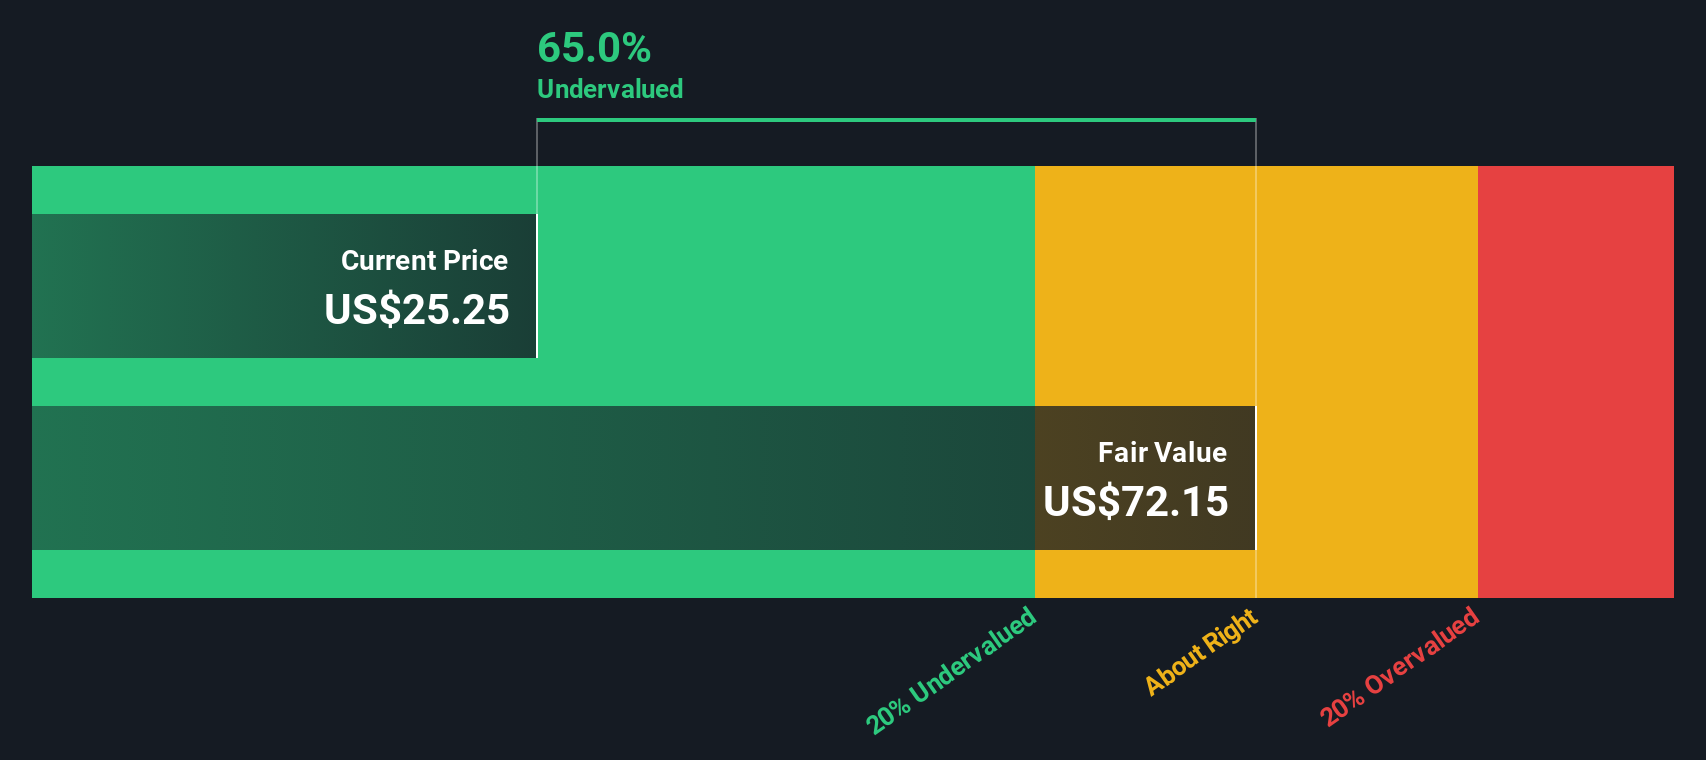
Dorchester Minerals (DMLP) has caught investor attention after recent price moves, with the unit price near US$24.70 and an indicated intrinsic discount of about 63%, prompting fresh questions about its royalty focused model.
See our latest analysis for Dorchester Minerals.
The recent 1 day share price return of 2.83% and 30 day share price return of 6.24% suggest some short term buying interest is emerging. However, the 1 year total shareholder return of an 11.46% decline contrasts with the very large 228.41% total shareholder return over five years, which hints that momentum has cooled recently compared with longer term gains.
If Dorchester Minerals has you thinking about income and energy exposure, it could be a good moment to widen your search with fast growing stocks with high insider ownership.
With units trading around US$24.70 and an indicated intrinsic discount near 63%, the key question is whether Dorchester Minerals is quietly undervalued or whether the market is already pricing in its future royalty income potential.
Preferred P/E of 22.3x: Is it justified?
Dorchester Minerals is trading on a P/E of 22.3x, which sits above the broader US Oil and Gas industry average of 13.5x despite the recent pullback in its unit price.
The P/E multiple compares the current unit price with earnings per unit and is often used for businesses like Dorchester Minerals that generate relatively steady royalty income rather than funding heavy capital projects.
A P/E of 22.3x means investors are currently paying a higher price for each dollar of earnings than the typical oil and gas name. This is occurring even though DMLP reported a 51.9% earnings decline over the past year and profit margins compressed from 66.7% to 37.1%. That combination suggests the market is still assigning a premium to the partnership, even as recent earnings and margin trends have softened.
Compared with the US Oil and Gas industry average P/E of 13.5x, DMLP screens as expensive on earnings. However, it screens as better value when set against a peer group average P/E of 27.4x. Relative to its direct peers it sits at a discount, but relative to the wider industry it trades on a clear premium multiple.
See what the numbers say about this price — find out in our valuation breakdown.
Result: Price-to-Earnings of 22.3x (OVERVALUED)
However, a premium P/E, alongside a 51.9% earnings decline and profit margin compression, could leave the units vulnerable if royalty income or sentiment weakens further.
Find out about the key risks to this Dorchester Minerals narrative.
Another view on value: what the cash flows say
The P/E ratio presents Dorchester Minerals as expensive versus the wider US Oil and Gas group, but our DCF model tells a different story. With the units at about $24.70 and an estimated future cash flow value of $67.09, the model indicates that the units are trading at a steep discount.
That gap suggests the market may be placing more weight on the recent 51.9% earnings decline and margin compression than on longer term cash generation. The key question for you is which signal you consider more informative: the earnings multiple or the cash flow math.
Look into how the SWS DCF model arrives at its fair value.
Simply Wall St performs a discounted cash flow (DCF) on every stock in the world every day (check out Dorchester Minerals for example). We show the entire calculation in full. You can track the result in your watchlist or portfolio and be alerted when this changes, or use our stock screener to discover 867 undervalued stocks based on their cash flows. If you save a screener we even alert you when new companies match - so you never miss a potential opportunity.
Build Your Own Dorchester Minerals Narrative
If you look at these numbers and reach a different conclusion, or simply prefer your own work, you can build a personal view in just a few minutes with Do it your way.
A great starting point for your Dorchester Minerals research is our analysis highlighting 1 key reward and 2 important warning signs that could impact your investment decision.
Looking for more investment ideas?
If Dorchester Minerals has caught your attention, do not stop here. Broaden your watchlist now so you are not the one hearing about strong ideas after everyone else.
- Chase potential mispricing by scanning these 867 undervalued stocks based on cash flows that line up with your view on cash flows, quality and entry price.
- Position yourself early in powerful themes by reviewing these 25 AI penny stocks riding advances in artificial intelligence and related technologies.
- Strengthen your income focus by checking out these 13 dividend stocks with yields > 3% that offer yields above 3% and may complement a royalty heavy approach.
This article by Simply Wall St is general in nature. We provide commentary based on historical data and analyst forecasts only using an unbiased methodology and our articles are not intended to be financial advice. It does not constitute a recommendation to buy or sell any stock, and does not take account of your objectives, or your financial situation. We aim to bring you long-term focused analysis driven by fundamental data. Note that our analysis may not factor in the latest price-sensitive company announcements or qualitative material. Simply Wall St has no position in any stocks mentioned.
Have feedback on this article? Concerned about the content? Get in touch with us directly. Alternatively, email editorial-team@simplywallst.com