

Is RPC (RES) Pricing Look Attractive After Recent Share Price Weakness?
- If you are wondering whether RPC's current share price offers good value or just more volatility, you are not alone. A closer look at its valuation can help frame that decision.
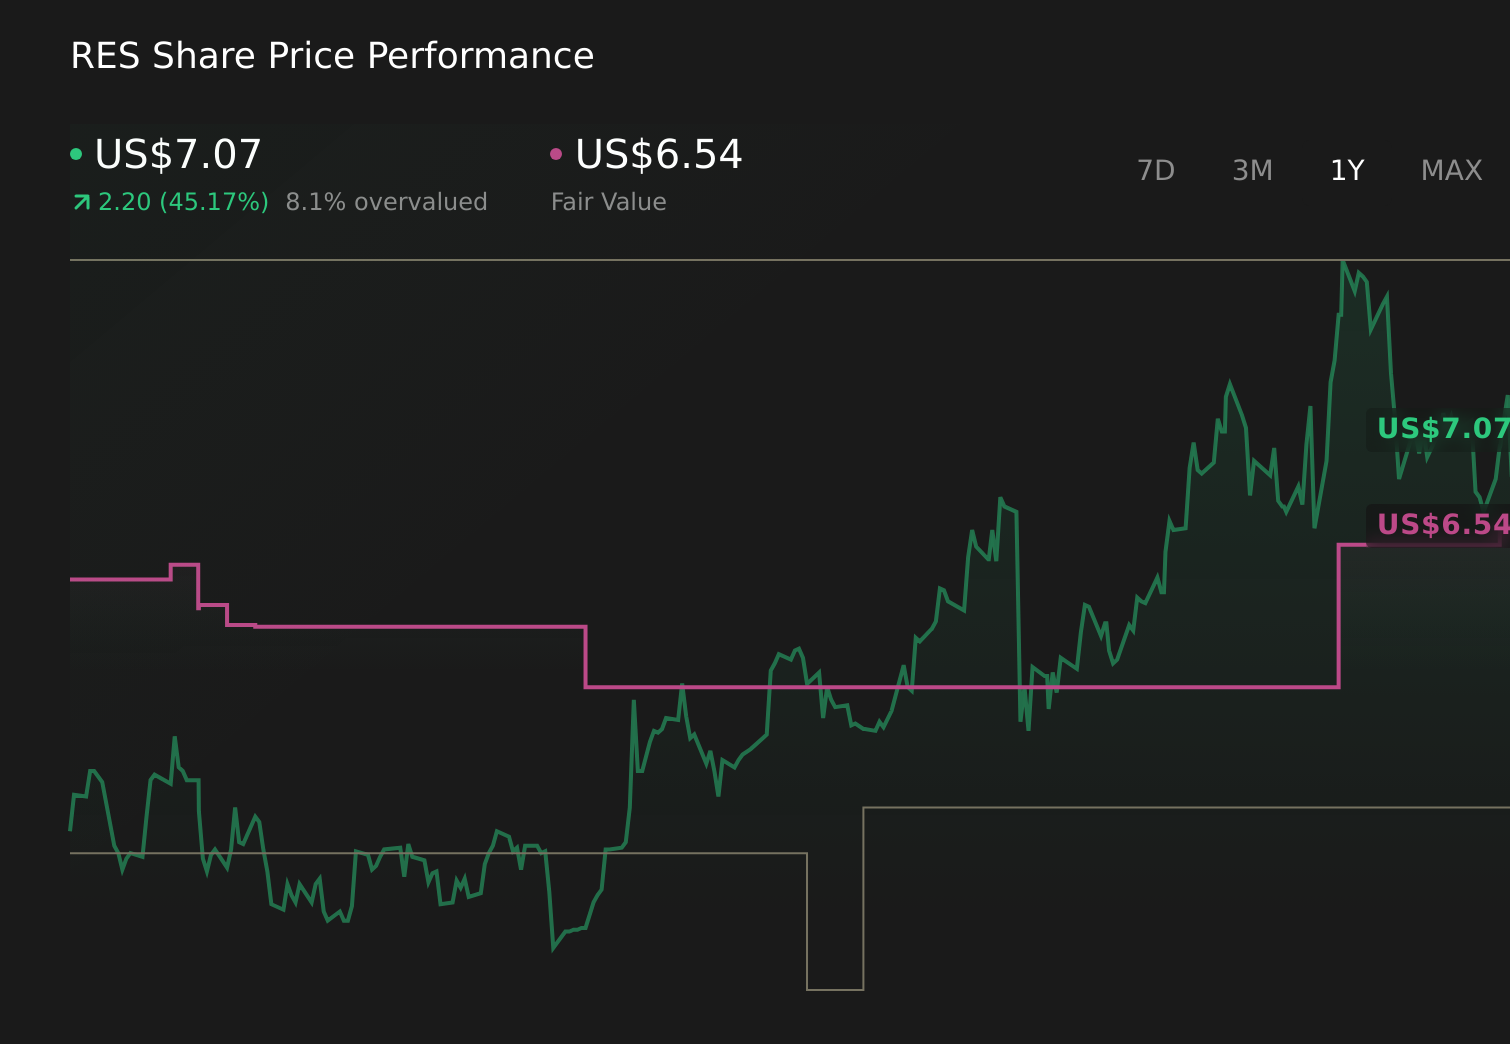
- The stock recently closed at US$5.66, with returns of a 10.9% decline over the past week, a 2.1% decline over the last month, a 2.4% gain year to date, and a 6.1% decline over the past year. The 3 year return is a 34.7% decline and the 5 year return is a 19.9% gain.
- Recent commentary around RPC has focused on how its share price swings connect to changing expectations for the energy services sector and investor sentiment toward smaller oilfield service providers. These themes are important context for thinking about whether the current price fairly reflects the company’s prospects and risks.
- Right now, RPC has a valuation score of 2 out of 6, which means it screens as undervalued on 2 of our 6 checks. Next we will look at what different valuation approaches say about that score, before finishing with a more holistic way to think about the stock’s value.
RPC scores just 2/6 on our valuation checks. See what other red flags we found in the full valuation breakdown.
Approach 1: RPC Discounted Cash Flow (DCF) Analysis
The Discounted Cash Flow model estimates what a company could be worth by projecting its future cash flows and then discounting those amounts back to today, so everything is in present value terms.
For RPC, the model uses a 2 stage Free Cash Flow to Equity approach based on cash flow projections. The most recent last twelve months free cash flow is about US$9.5 million. Looking ahead, analysts provide estimates out to 2028, with free cash flow for that year projected at US$66 million, and Simply Wall St extrapolates further out to 2035 using estimated growth rates for each year.
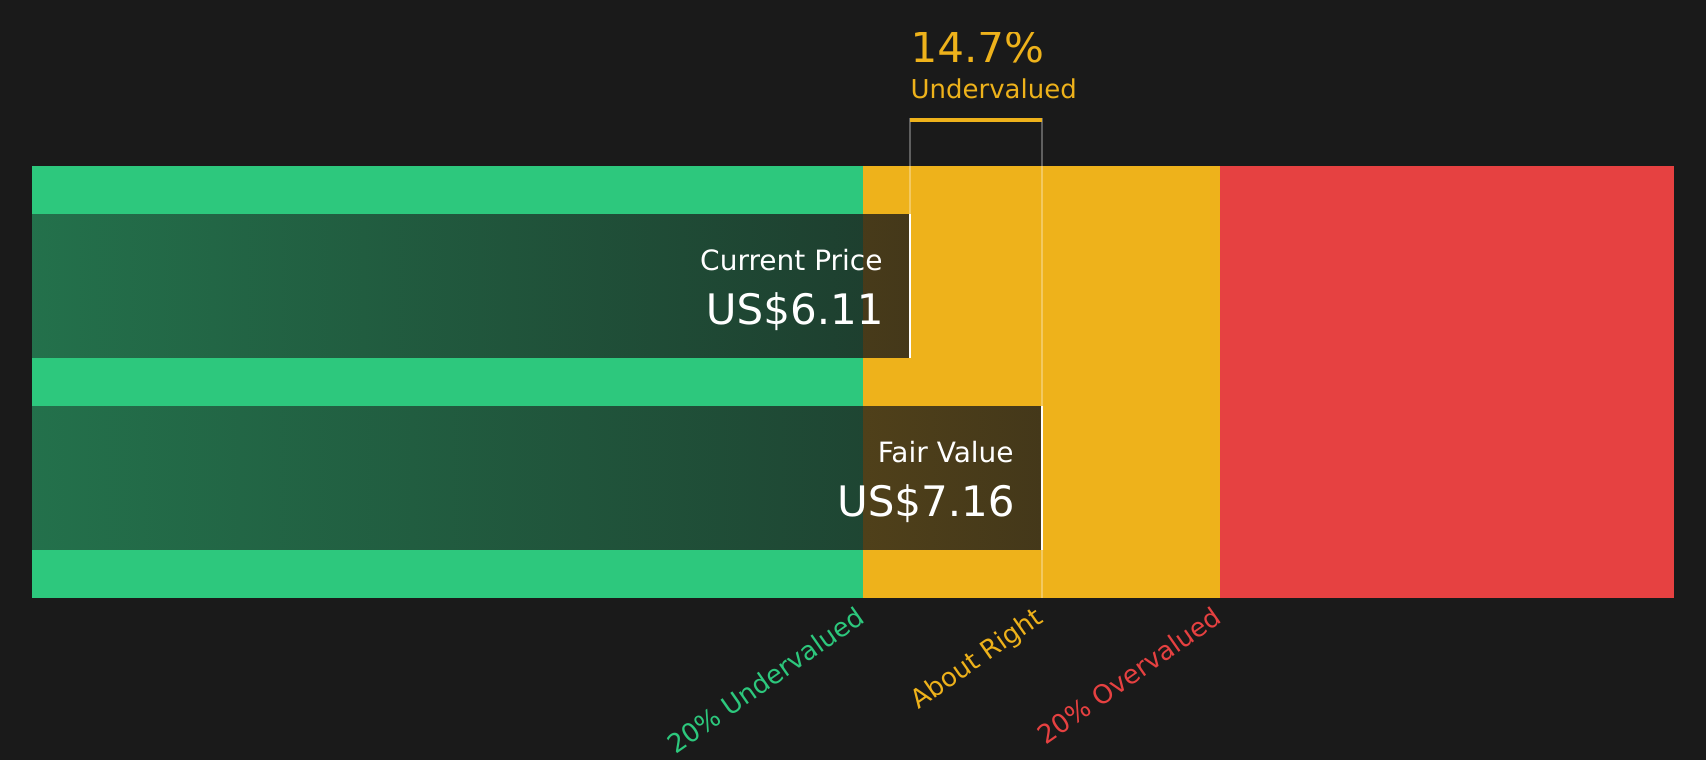
Each of these projected cash flows, from 2026 through 2035, is discounted back to today and then summed to arrive at an estimated intrinsic value per share of US$8.28. Compared with the recent share price of US$5.66, this implies a 31.7% discount, which indicates the stock screens as undervalued on this DCF view.
Result: UNDERVALUED
Our Discounted Cash Flow (DCF) analysis suggests RPC is undervalued by 31.7%. Track this in your watchlist or portfolio, or discover 861 more undervalued stocks based on cash flows.
Approach 2: RPC Price vs Earnings
For a profitable company, the P/E ratio is a straightforward way to see how much you are paying for each dollar of current earnings. It ties directly to what the business is earning today, which many investors find easier to relate to than long term cash flow forecasts.
What counts as a “normal” P/E ratio usually reflects how the market views a company’s growth potential and risk. Higher expected growth or lower perceived risk can support a higher P/E, while slower growth or higher risk often goes with a lower P/E.
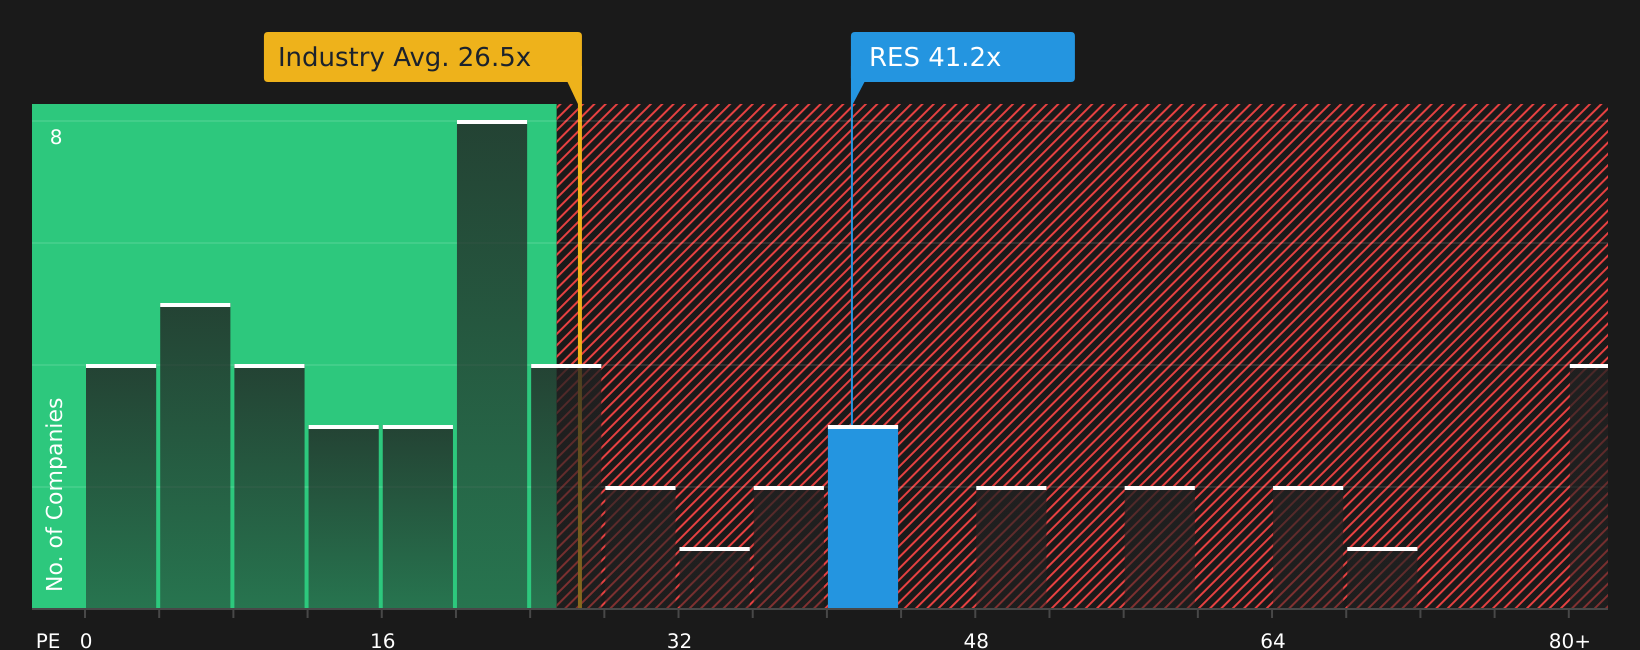
RPC currently trades on a P/E of 38.27x. That is above the Energy Services industry average of 23.36x and also above the peer group average of 28.53x. Simply Wall St’s Fair Ratio for RPC is 19.39x, which is a proprietary estimate of what the P/E might look like after adjusting for factors such as earnings growth, industry, profit margins, market cap and risk profile.
This Fair Ratio goes further than a simple peer or industry comparison because it aims to tailor the “appropriate” multiple to RPC’s specific characteristics. Set against the current P/E of 38.27x, the Fair Ratio of 19.39x suggests the shares screen as expensive on this earnings based view.
Result: OVERVALUED
P/E ratios tell one story, but what if the real opportunity lies elsewhere? Discover 1432 companies where insiders are betting big on explosive growth.
Upgrade Your Decision Making: Choose your RPC Narrative
Earlier we mentioned that there is an even better way to understand valuation, so let us introduce you to Narratives, which bring your view of a company together with the numbers behind it. A Narrative is simply your story about RPC, backed by your own fair value estimate and your expectations for future revenue, earnings and margins. On Simply Wall St, within the Community page used by millions of investors, Narratives help you link that story to a financial forecast and then to a fair value that you can compare directly with the current share price to decide whether you might want to buy, hold or sell. Because Narratives update automatically when new information such as news or earnings is added, your view stays current without you needing to rebuild your analysis from scratch. For example, one RPC Narrative might assume a fair value that differs significantly from today’s price, while another Narrative might see fair value closer to or below the current price, reflecting different assumptions about the company’s outlook and risk.
Do you think there's more to the story for RPC? Head over to our Community to see what others are saying!
This article by Simply Wall St is general in nature. We provide commentary based on historical data and analyst forecasts only using an unbiased methodology and our articles are not intended to be financial advice. It does not constitute a recommendation to buy or sell any stock, and does not take account of your objectives, or your financial situation. We aim to bring you long-term focused analysis driven by fundamental data. Note that our analysis may not factor in the latest price-sensitive company announcements or qualitative material. Simply Wall St has no position in any stocks mentioned.
Have feedback on this article? Concerned about the content? Get in touch with us directly. Alternatively, email editorial-team@simplywallst.com