

Reassessing Tencent Music Entertainment Group (TME) After Recent Share Price Pullback
- If you are wondering whether Tencent Music Entertainment Group is attractively priced after recent volatility, or if you would be overpaying at today’s levels, this article focuses squarely on what you are getting for the price you pay.
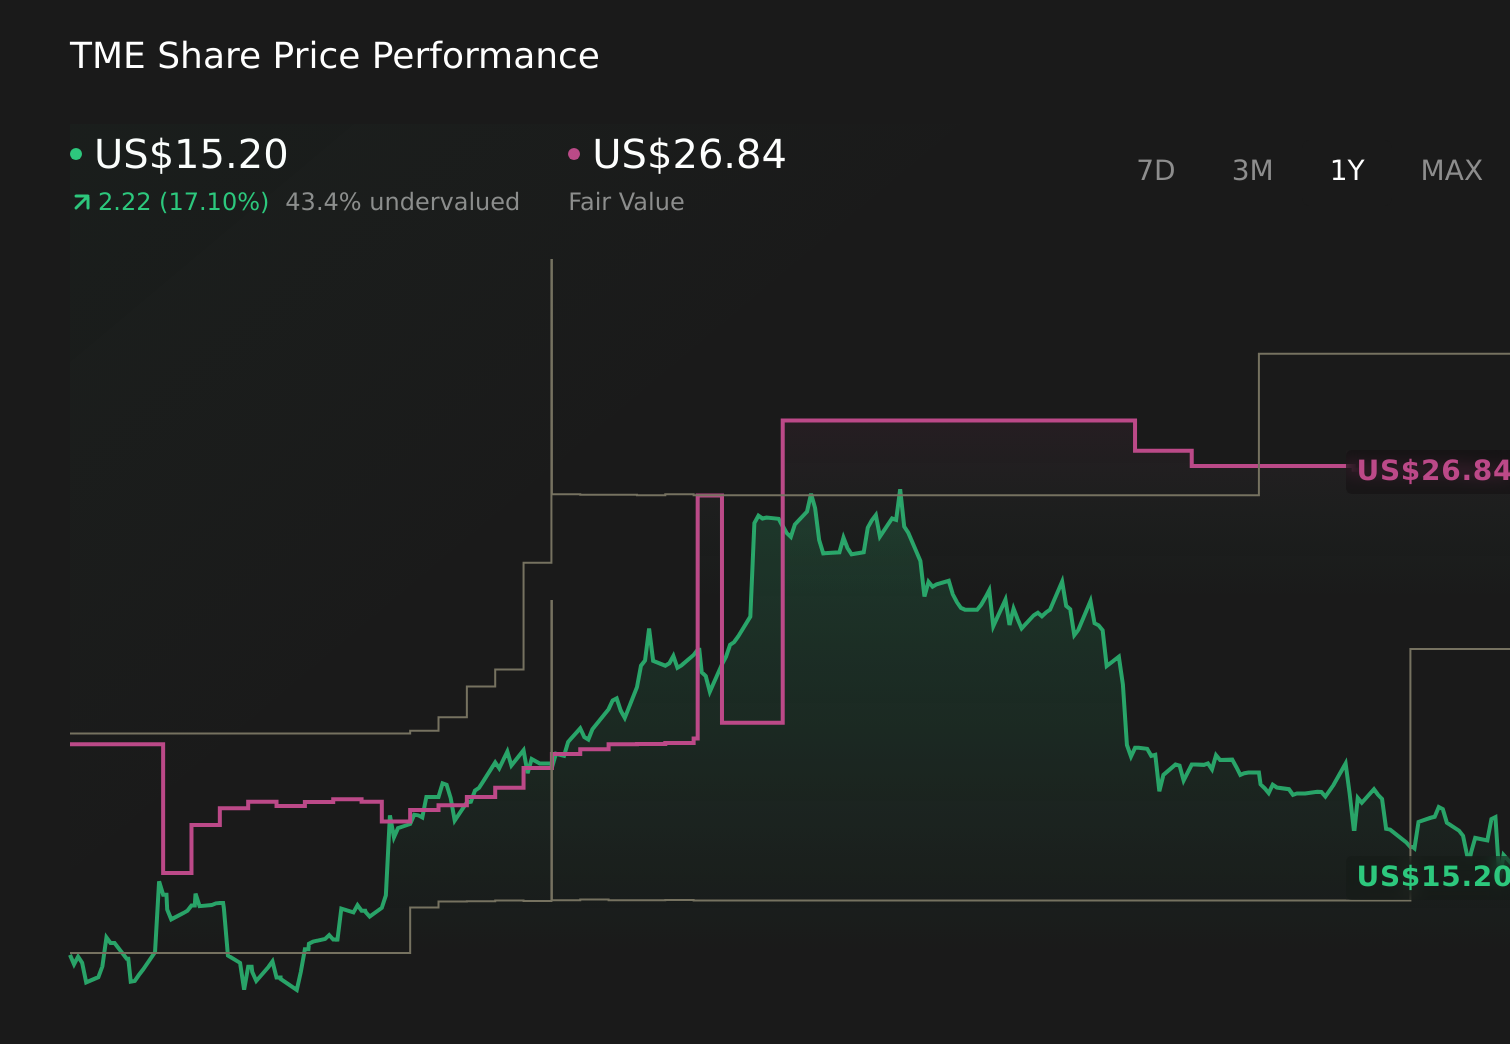
- The stock last closed at US$15.84, with a 7 day return of an 8.1% decline, a 30 day return of a 14.3% decline, a year to date return of an 11.3% decline, and a 1 year return of 36.5% that sits against a 3 year return of 93.9% and a 5 year return of a 38.5% decline.
- Recent attention on Tencent Music Entertainment Group has been shaped by ongoing interest in major Chinese tech names and changing risk appetite toward U.S. listed ADRs. These themes help frame how investors may be thinking about growth potential and risk when they reassess what counts as a fair price for TME.
- On Simply Wall St’s 6 point valuation framework, Tencent Music Entertainment Group scores a full 6 / 6 valuation score. Next we will look at the traditional valuation methods behind that outcome, before finishing with a different way of thinking about what the stock might be worth.
Approach 1: Tencent Music Entertainment Group Discounted Cash Flow (DCF) Analysis
A Discounted Cash Flow, or DCF, model takes estimates of a company’s future cash flows and discounts them back to today using a required rate of return, to arrive at an estimate of what the business might be worth now.
For Tencent Music Entertainment Group, the model uses a 2 Stage Free Cash Flow to Equity approach. The latest twelve month free cash flow is CN¥9,146.77m. Analysts have provided cash flow estimates for the coming years, and Simply Wall St extends those out further, with projected free cash flow of CN¥17,009m in 2030. These longer term figures are based on a combination of analyst inputs for the nearer years and extrapolated estimates for the later years.
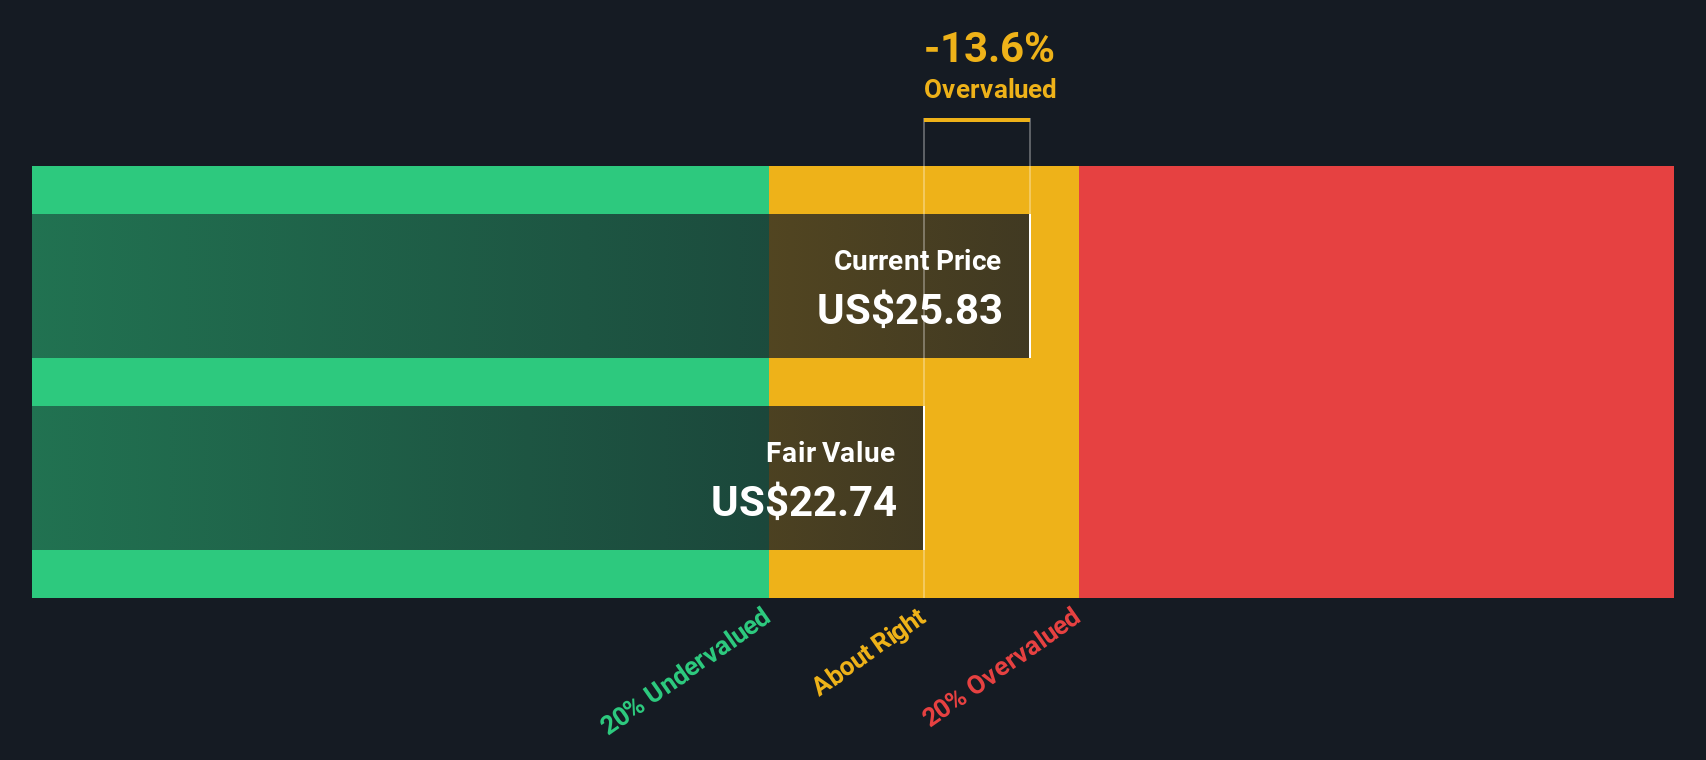
When all of those projected cash flows are discounted back and summed, the model arrives at an estimated intrinsic value of US$22.42 per share. Compared with the recent share price of US$15.84, this implies Tencent Music Entertainment Group trades at a 29.4% discount to that DCF estimate. On this model, the stock appears to be undervalued.
Result: UNDERVALUED
Our Discounted Cash Flow (DCF) analysis suggests Tencent Music Entertainment Group is undervalued by 29.4%. Track this in your watchlist or portfolio, or discover 867 more undervalued stocks based on cash flows.
Approach 2: Tencent Music Entertainment Group Price vs Earnings
For a profitable company like Tencent Music Entertainment Group, the P/E ratio is a useful way to relate what you pay for each share to the earnings that business is currently generating. It gives you a quick sense of how many dollars investors are willing to pay today for one dollar of current earnings.
What counts as a “normal” or “fair” P/E depends on how the market views a company’s growth prospects and risk. Higher expected growth or lower perceived risk can justify a higher P/E, while slower growth or higher risk can justify a lower one.
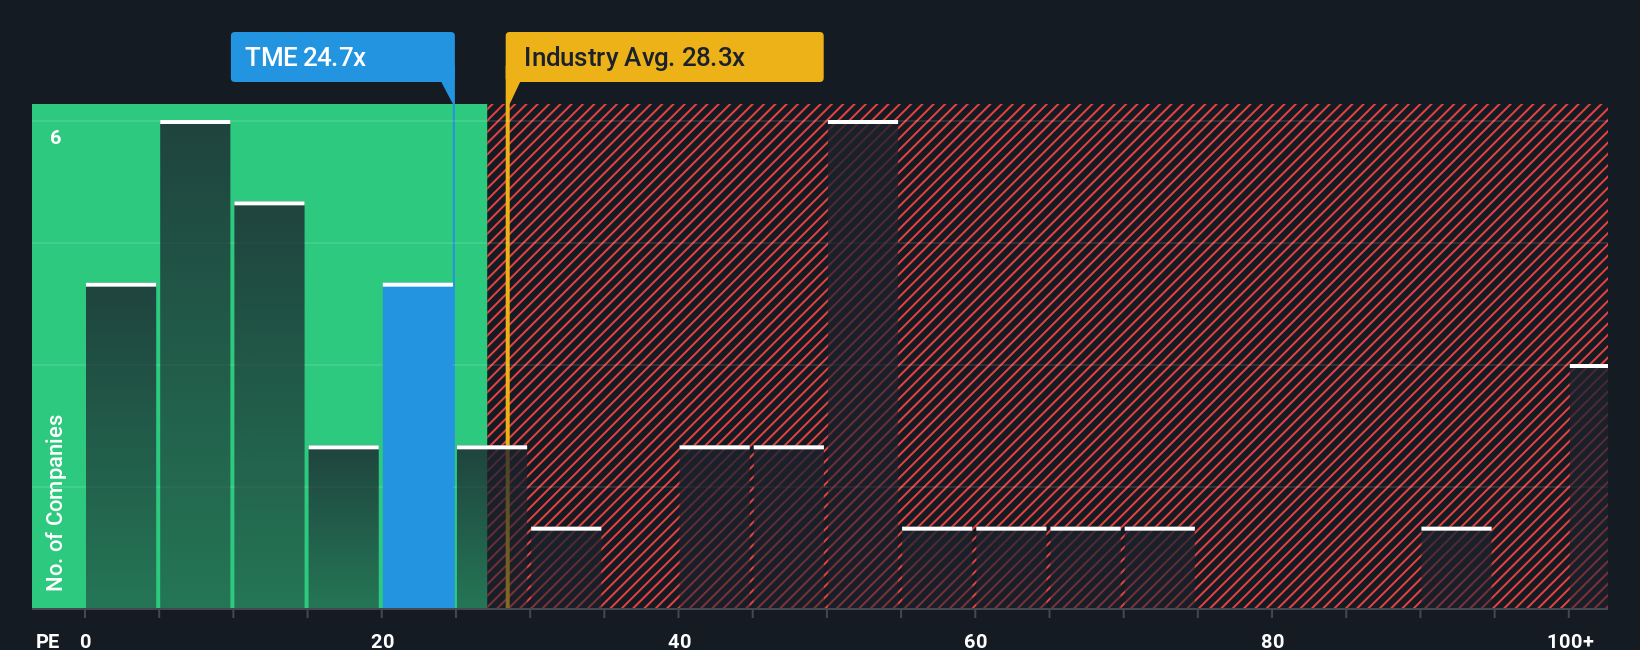
Tencent Music Entertainment Group currently trades on a P/E of 15.75x. That sits below the Entertainment industry average of about 27.72x and the peer group average of 94.63x. Simply Wall St’s Fair Ratio for Tencent Music Entertainment Group is 23.12x, which is its own estimate of a suitable P/E given the company’s earnings profile, industry, profit margins, market value and risk factors. This Fair Ratio can be more useful than plain industry or peer comparisons because it adjusts for those company specific features rather than assuming a one size fits all benchmark. Since the current P/E of 15.75x is below the Fair Ratio of 23.12x, the shares appear undervalued on this approach.
Result: UNDERVALUED
P/E ratios tell one story, but what if the real opportunity lies elsewhere? Discover 1433 companies where insiders are betting big on explosive growth.
Upgrade Your Decision Making: Choose your Tencent Music Entertainment Group Narrative
Earlier we mentioned that there is an even better way to think about valuation. On Simply Wall St this comes from Narratives, which let you attach a clear story about Tencent Music Entertainment Group to your own numbers for fair value, future revenue, earnings and margins. You can then link that story to a forecast and a fair value that you can easily compare with today’s share price to support your decision making.
On the Community page, millions of investors share Narratives that are simple to use. You pick the Narrative that matches your view, or create your own, and the platform keeps that Narrative updated when new information like earnings or news is added so your fair value view stays aligned with the latest data.
For Tencent Music Entertainment Group, one investor might build a Narrative that assumes relatively cautious revenue expectations and modest profit margins, while another might use stronger revenue assumptions and higher margins. Those two stories can lead to very different fair values and very different conclusions when each investor compares their fair value to the current share price.
Do you think there's more to the story for Tencent Music Entertainment Group? Head over to our Community to see what others are saying!
This article by Simply Wall St is general in nature. We provide commentary based on historical data and analyst forecasts only using an unbiased methodology and our articles are not intended to be financial advice. It does not constitute a recommendation to buy or sell any stock, and does not take account of your objectives, or your financial situation. We aim to bring you long-term focused analysis driven by fundamental data. Note that our analysis may not factor in the latest price-sensitive company announcements or qualitative material. Simply Wall St has no position in any stocks mentioned.
Have feedback on this article? Concerned about the content? Get in touch with us directly. Alternatively, email editorial-team@simplywallst.com