

Is It Too Late To Consider United Rentals (URI) After Recent Share Price Pullback?
- For readers considering whether United Rentals at around US$848 a share is still a solid deal or if the easy money has already been made, this article explains what the current price implies about value.
- The stock has had a mixed run, with a 6.1% decline over the last 7 days and a 4.4% decline over the last 30 days, while still showing a 15.9% return over 1 year, 90.6% over 3 years, and 216.3% over 5 years.
- Recent attention on United Rentals has focused on its role as a major equipment rental provider for large construction and infrastructure projects. Investors are weighing how sensitive that exposure might be to shifts in project activity and capital spending. At the same time, broader discussions about equipment demand and rental utilization have shaped how some investors think about the risk and reward trade off in the stock.
- Our valuation checks currently give United Rentals a score of 3 out of 6. This suggests there are parts of the market pricing that may not fully align with certain valuation models. We will walk through those approaches next, before finishing with a more holistic way to think about the company’s value.
Find out why United Rentals's 15.9% return over the last year is lagging behind its peers.
Approach 1: United Rentals Discounted Cash Flow (DCF) Analysis
A Discounted Cash Flow model takes projected future cash flows and then discounts them back to today using a required rate of return to estimate what the business could be worth right now.
For United Rentals, the latest twelve month Free Cash Flow is about $2.3b. The 2 Stage Free Cash Flow to Equity model used here relies on analyst estimates for the next few years and then extends those projections further out. By 2030, projected Free Cash Flow is $3.192b, with interim annual forecasts between 2026 and 2035 ranging from roughly $2.166b to $3.796b in nominal terms, before discounting.
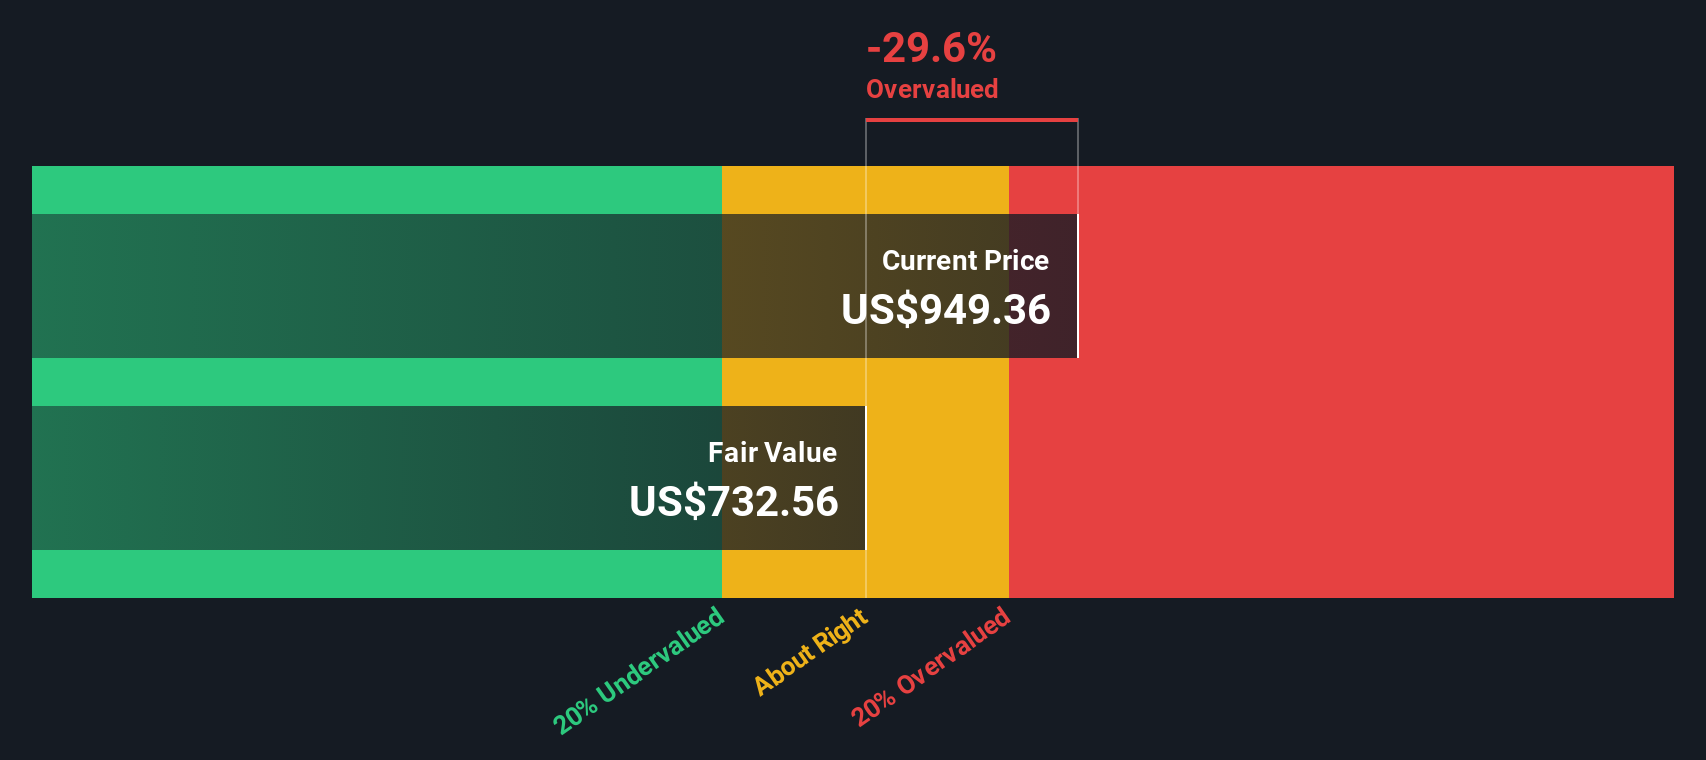
After discounting those cash flows back to today, the model arrives at an estimated intrinsic value of about $824.46 per share. Against a current share price around $848, the DCF output suggests the stock is about 2.9% overvalued, which is effectively in the same ballpark as the market price.
Result: ABOUT RIGHT
United Rentals is fairly valued according to our Discounted Cash Flow (DCF), but this can change at a moment's notice. Track the value in your watchlist or portfolio and be alerted on when to act.
Approach 2: United Rentals Price vs Earnings
For a profitable company like United Rentals, the P/E ratio is a useful way to think about what you are paying for each dollar of current earnings. Investors typically accept a higher or lower P/E based on what they expect for future earnings growth and how much risk they see in those earnings.
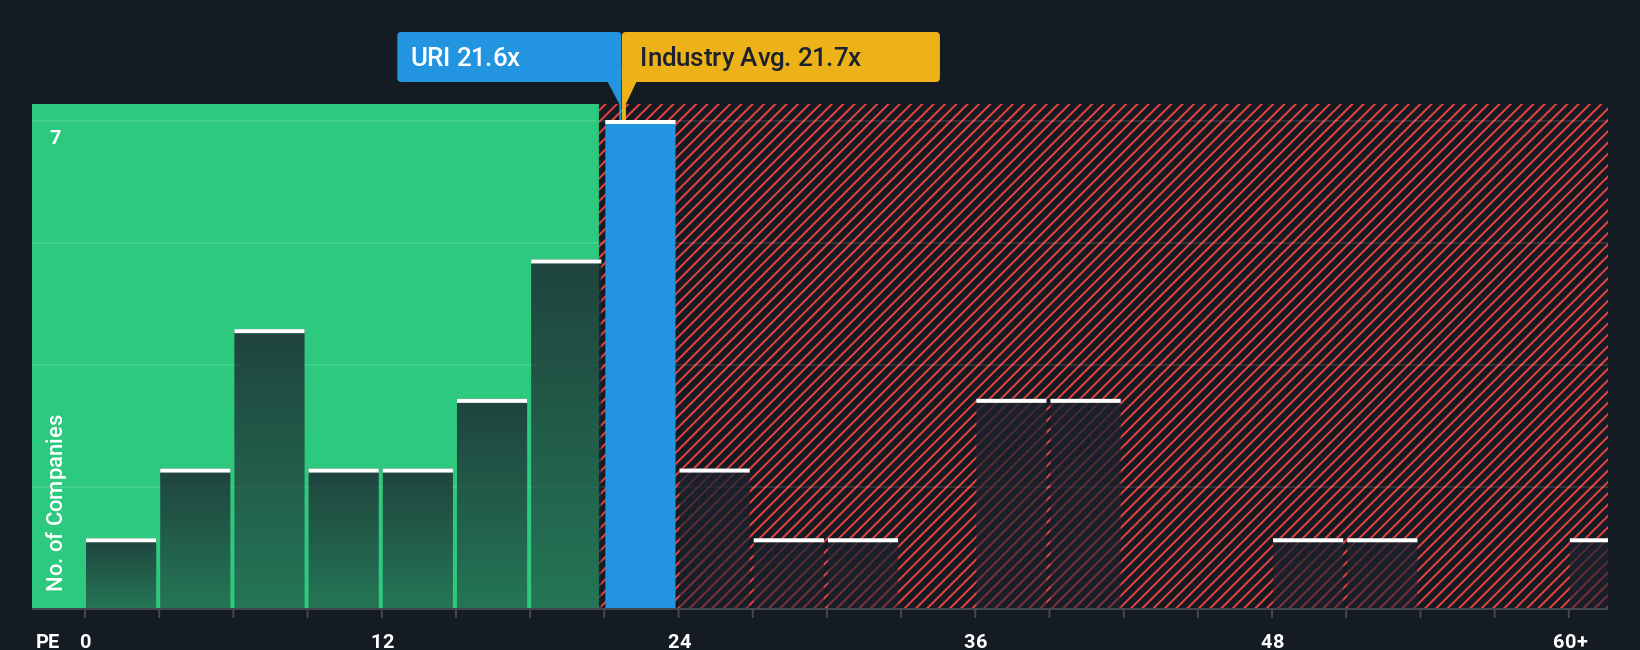
United Rentals currently trades on a P/E of 21.4x. That sits below both the Trade Distributors industry average of 23.9x and the peer group average of 26.7x, so on simple market comparisons the shares are priced at a discount to many similar businesses.
Simply Wall St’s Fair Ratio for United Rentals is 34.3x. This is a proprietary estimate of what the P/E could be, given the company’s earnings growth profile, industry, profit margins, market cap and specific risks. Because it adjusts for these factors rather than just comparing with broad peer or industry averages, it can give a more tailored view of what a reasonable multiple might look like for this particular business. When this is set against the current P/E of 21.4x, the Fair Ratio points to the shares trading below that modeled level.
Result: UNDERVALUED
P/E ratios tell one story, but what if the real opportunity lies elsewhere? Discover 1433 companies where insiders are betting big on explosive growth.
Upgrade Your Decision Making: Choose your United Rentals Narrative
Earlier we mentioned that there is an even better way to understand valuation, so let us introduce you to Narratives, which are simply your story about United Rentals linked directly to numbers like your fair value, revenue, earnings and margin assumptions.
A Narrative connects three things in one place: the story you believe about the business, the forecast you think fits that story, and the fair value that follows from those assumptions.
On Simply Wall St, you can build and explore these Narratives on the Community page, where millions of investors share their own views in a format that is straightforward to read and compare.
Each Narrative helps you decide whether United Rentals looks attractive by setting a Fair Value and lining that up against the current share price, and it automatically refreshes when new data such as earnings reports or news is added to the platform.
For example, one United Rentals Narrative might assume a relatively low fair value with modest future margins, while another might set a much higher fair value with stronger margin expectations, giving you a clear view of how different perspectives translate into very different price opinions.
Do you think there's more to the story for United Rentals? Head over to our Community to see what others are saying!
This article by Simply Wall St is general in nature. We provide commentary based on historical data and analyst forecasts only using an unbiased methodology and our articles are not intended to be financial advice. It does not constitute a recommendation to buy or sell any stock, and does not take account of your objectives, or your financial situation. We aim to bring you long-term focused analysis driven by fundamental data. Note that our analysis may not factor in the latest price-sensitive company announcements or qualitative material. Simply Wall St has no position in any stocks mentioned.
Have feedback on this article? Concerned about the content? Get in touch with us directly. Alternatively, email editorial-team@simplywallst.com