

Is Driven Brands (DRVN) Pricing Look Interesting After Recent Share Price Rebound
- If you are wondering whether Driven Brands Holdings is attractively priced today, this article walks through what the current numbers may imply about the stock's value.
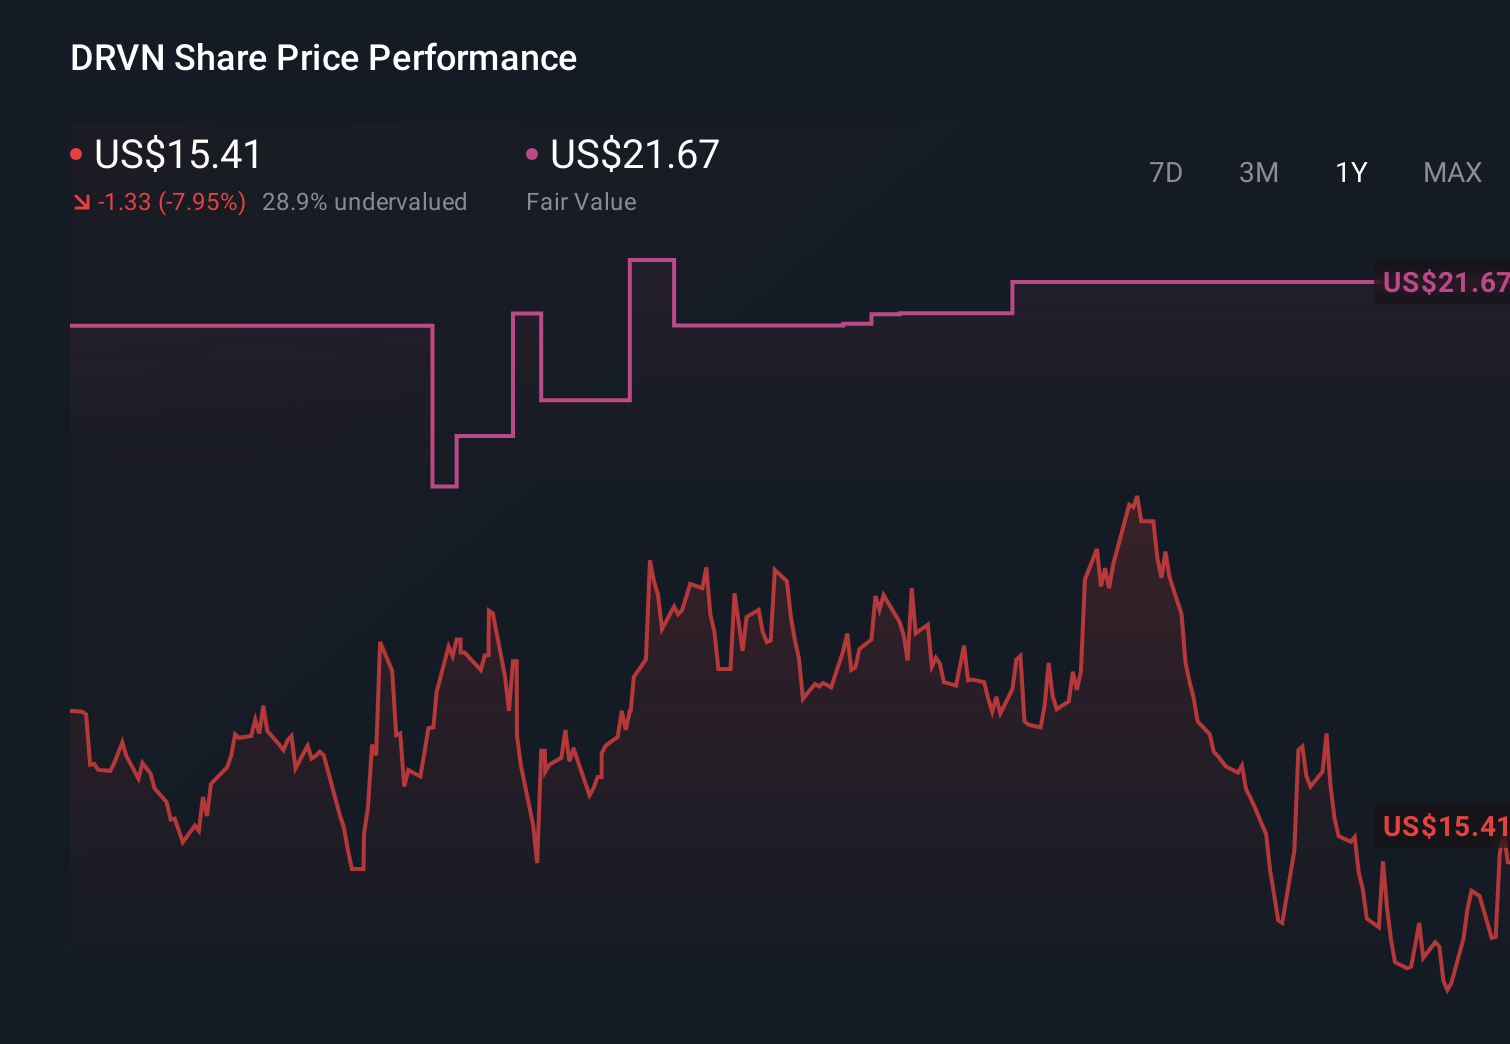
- The shares last closed at US$16.66, with recent returns of 9.5% over 7 days, 11.4% over 30 days, 14.9% year to date and 1.3% over the past year, set against a 41.5% decline over 3 years and a 49.3% decline over 5 years.
- Recent news around Driven Brands has focused on the business and its positioning within consumer services. This helps frame how investors may be thinking about the share price moves you see in the short and long term. This context is useful to keep in mind as you weigh up whether the current price matches your expectations for the company.
- On our valuation checklist, Driven Brands scores a 5 out of 6. This sets up a closer look at different valuation methods next, and we will also touch on a more comprehensive way to think about value at the end of the article.
Approach 1: Driven Brands Holdings Discounted Cash Flow (DCF) Analysis
A Discounted Cash Flow, or DCF, model estimates what a business could be worth today by projecting its future cash flows and discounting them back to the present.
For Driven Brands Holdings, the model used here is a 2 Stage Free Cash Flow to Equity approach, working with cash flows in US$. The latest twelve month free cash flow is a loss of $168.2 million, so the valuation relies heavily on future projections rather than recent cash generation.
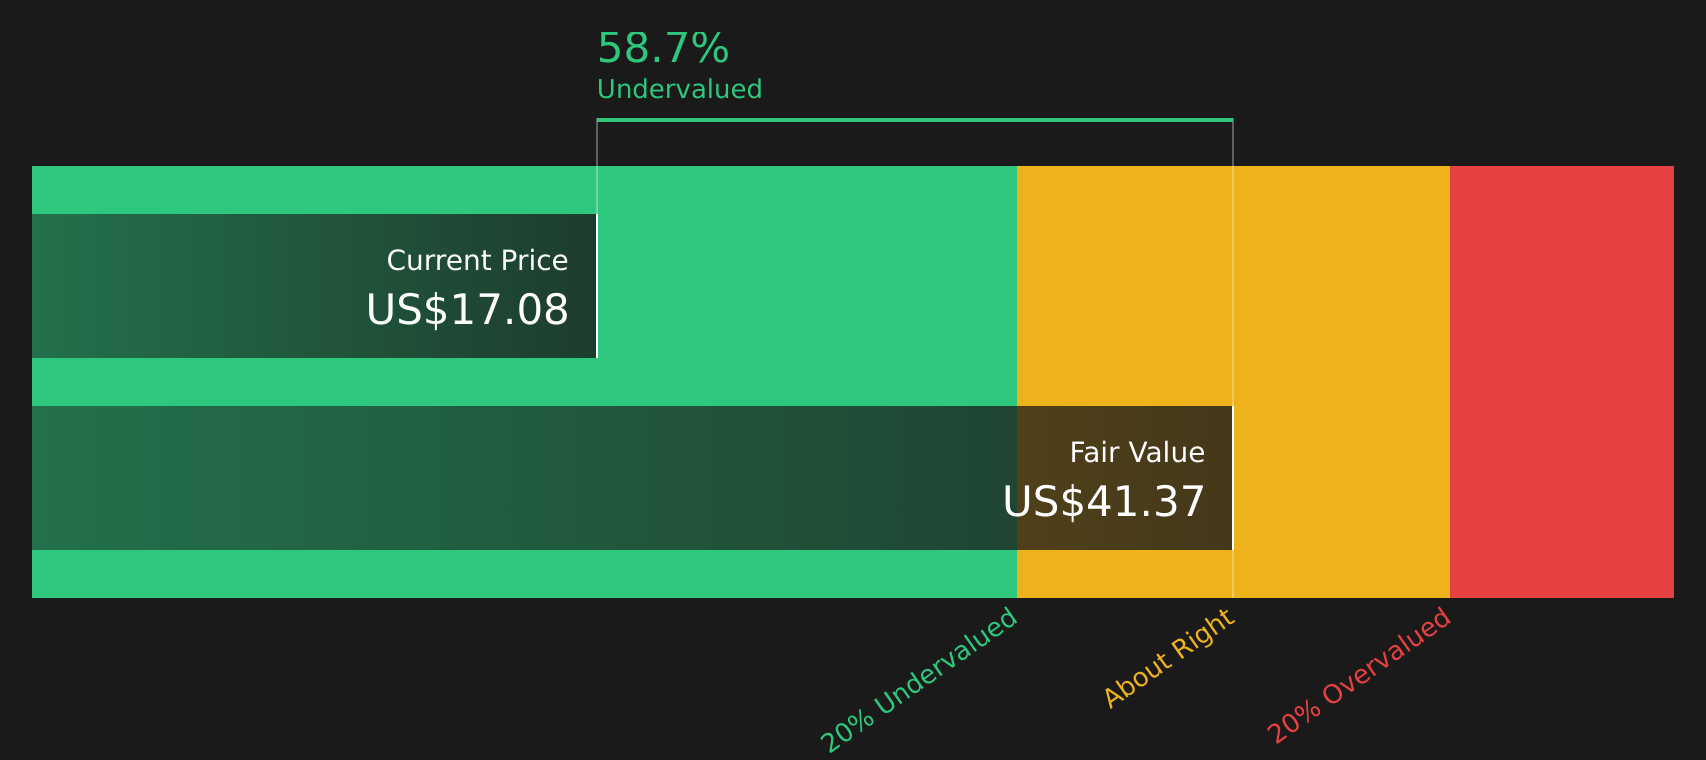
Analyst estimates and extrapolations point to free cash flow of $190.2 million in 2026 and $342 million in 2029, with further projected figures reaching about $525.2 million in 2035. Simply Wall St extrapolates beyond the first few analyst covered years to build a full 10 year path of expected cash flows, then discounts those back using its chosen rate to arrive at an estimated intrinsic value of $41.04 per share.
Compared to the recent share price of $16.66, this DCF output implies Driven Brands trades at a 59.4% discount to that intrinsic value, which indicates the stock screens as materially undervalued on this model alone.
Result: UNDERVALUED
Our Discounted Cash Flow (DCF) analysis suggests Driven Brands Holdings is undervalued by 59.4%. Track this in your watchlist or portfolio, or discover 55 more high quality undervalued stocks.
Approach 2: Driven Brands Holdings Price vs Sales
For companies where investors focus on revenue rather than current profits, the P/S ratio is often a practical way to think about value, because it compares the share price to the sales the business is already generating.
What counts as a normal or fair P/S ratio usually reflects how quickly the market expects revenue to grow and how confident it is about the risks around that growth. Higher growth potential or perceived resilience can support a higher multiple, while higher risk or weaker expectations tend to pull it down.
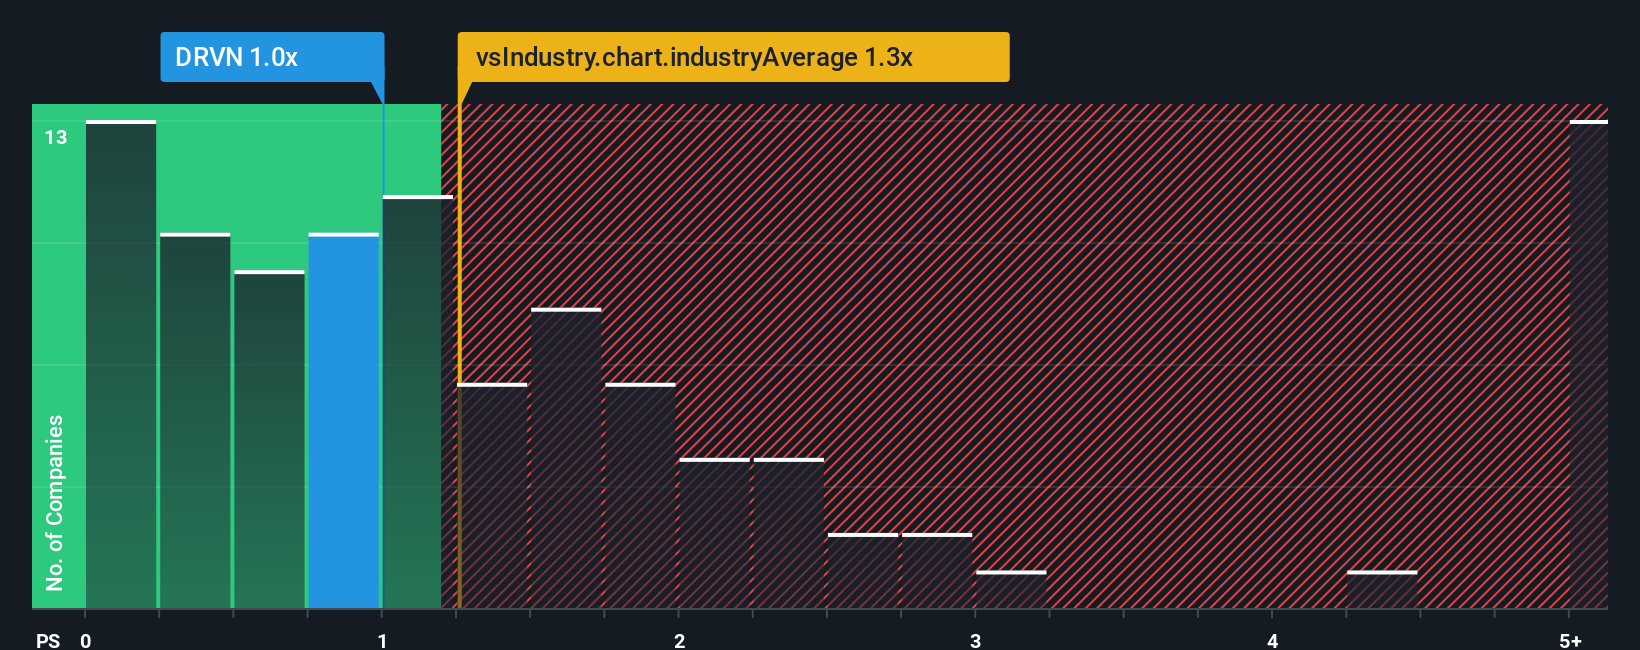
Driven Brands currently trades on a P/S of 1.12x. That sits below the Consumer Services industry average of 1.29x and below the peer group average of 1.81x. Simply Wall St’s Fair Ratio for Driven Brands is 1.09x. This is its proprietary estimate of what the P/S should be after considering factors such as earnings growth, profit margins, risk profile, industry and market cap.
Because the Fair Ratio is tailored to the company’s own characteristics, it can be more informative than a simple comparison with peers or the broad industry. With the actual P/S of 1.12x sitting very close to the Fair Ratio of 1.09x, the shares look priced at about the level this framework would suggest.
Result: ABOUT RIGHT
P/S ratios tell one story, but what if the real opportunity lies elsewhere? Start investing in legacies, not executives. Discover our 22 top founder-led companies.
Upgrade Your Decision Making: Choose your Driven Brands Holdings Narrative
Earlier we mentioned that there is an even better way to understand valuation, so let us introduce you to Narratives, a simple way for you to write the story behind your numbers, including your view of fair value and your expectations for future revenue, earnings and margins.
A Narrative links three things together: the company story you believe in, the financial forecast that flows from that story, and the fair value that those forecasts point to.
On Simply Wall St, Narratives sit inside the Community page and are designed so any investor can quickly set assumptions, see a fair value estimate, and then compare that to the current share price to help decide whether they think now is a time to buy, hold or sell.
Narratives are refreshed as new information, such as news or earnings updates, comes in so your view of Driven Brands can stay aligned with what is happening. You can also see how other investors reach very different fair values for the same company. For example, one Narrative might assume a much higher fair value than the current price, while another might set a far lower fair value based on a more cautious outlook.
Do you think there's more to the story for Driven Brands Holdings? Head over to our Community to see what others are saying!
This article by Simply Wall St is general in nature. We provide commentary based on historical data and analyst forecasts only using an unbiased methodology and our articles are not intended to be financial advice. It does not constitute a recommendation to buy or sell any stock, and does not take account of your objectives, or your financial situation. We aim to bring you long-term focused analysis driven by fundamental data. Note that our analysis may not factor in the latest price-sensitive company announcements or qualitative material. Simply Wall St has no position in any stocks mentioned.
Have feedback on this article? Concerned about the content? Get in touch with us directly. Alternatively, email editorial-team@simplywallst.com