

Is It Time To Reassess Bunge Global (BG) After Its Strong 1-Year Share Price Surge
- If you are wondering whether Bunge Global's share price fairly reflects its business today, you are not alone. This article is here to help you size up what you are actually paying for.
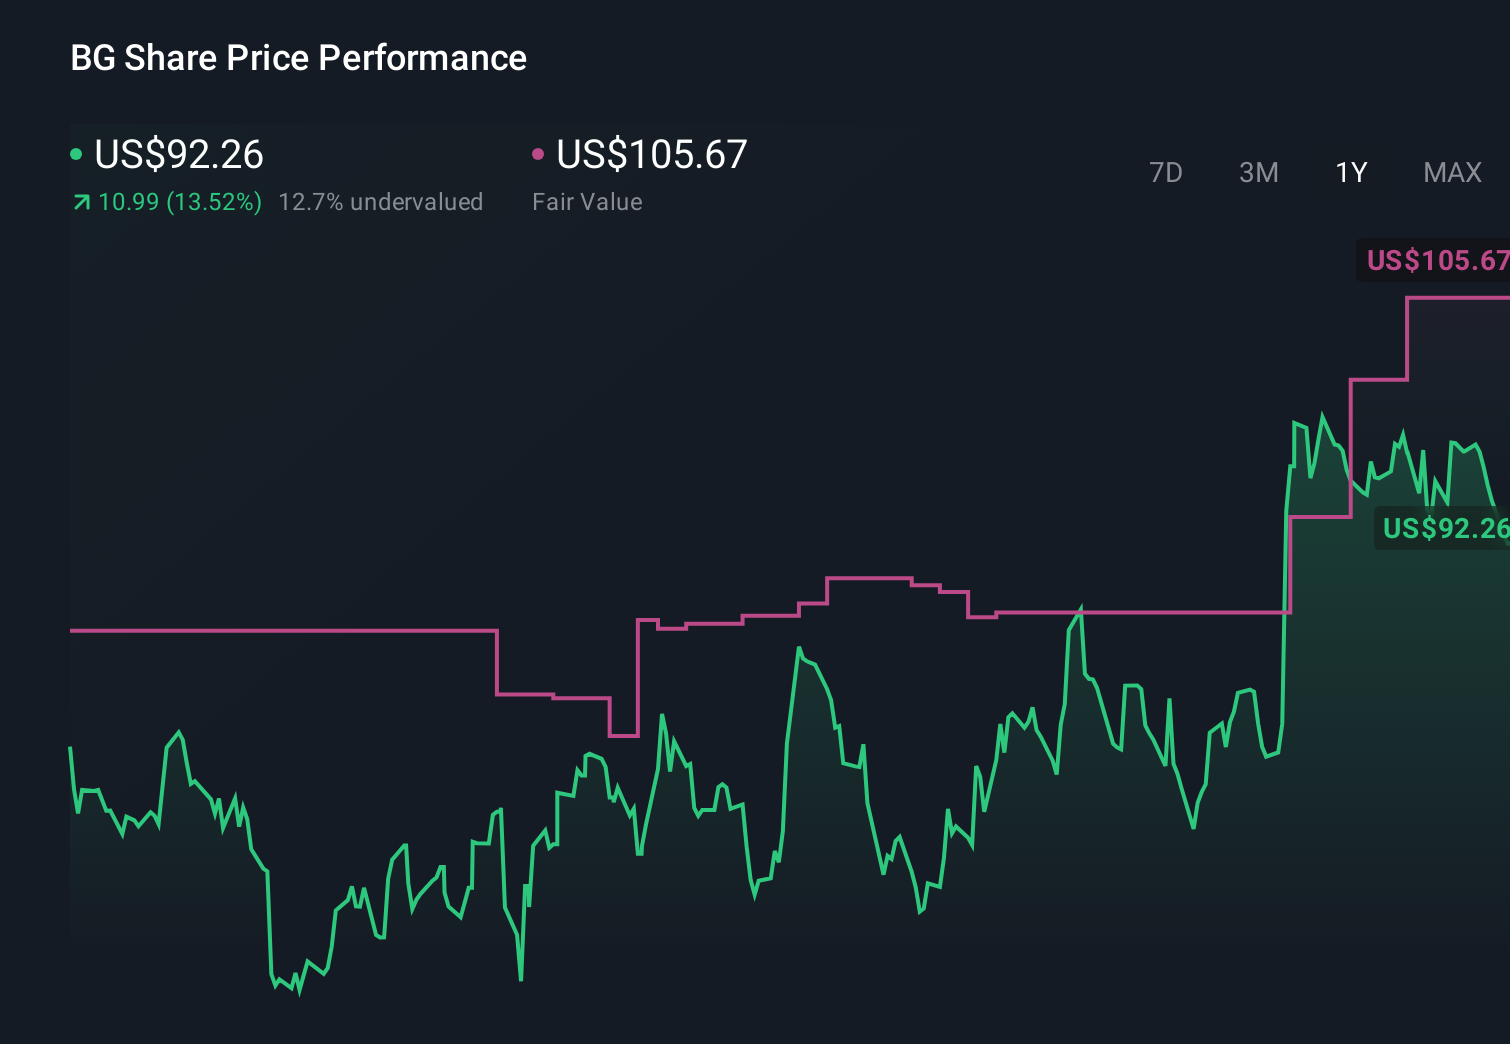
- The stock closed at US$113.94, with a 1.1% decline over the last 7 days, while returns sit at 20.8% over 30 days, 23.0% year to date, 70.2% over 1 year, 29.5% over 3 years and 71.1% over 5 years.
- These moves have put Bunge Global back on many investors radars, as they reassess what is already priced into the stock and what might still be overlooked. Recent news coverage has mainly focused on its role in global agriculture and food supply, which shapes how the market views its risk profile and long term relevance.
- On our checks, Bunge Global currently scores 4 out of 6 on valuation based on our valuation score. Next we will walk through the key valuation approaches behind that score, before finishing with a tool that can help you assess value even more effectively for yourself.
Approach 1: Bunge Global Discounted Cash Flow (DCF) Analysis
A Discounted Cash Flow, or DCF, model takes estimates of the cash Bunge Global might generate in the future and discounts those amounts back to today using a required rate of return, to arrive at an estimate of what the business could be worth now.
For Bunge Global, the model used is a 2 Stage Free Cash Flow to Equity approach, based on cash flow projections expressed in US$. The latest twelve month free cash flow figure is a loss of $778.38 million, so the model leans heavily on future projections rather than recent cash generation.
Analyst data and Simply Wall St estimates project free cash flow rising to $4.77 billion by 2035, with interim points such as $2.14 billion in 2026 and $2.64 billion in 2027. Each of these future figures is discounted back to today, and combined with an estimate for cash flows beyond that period.
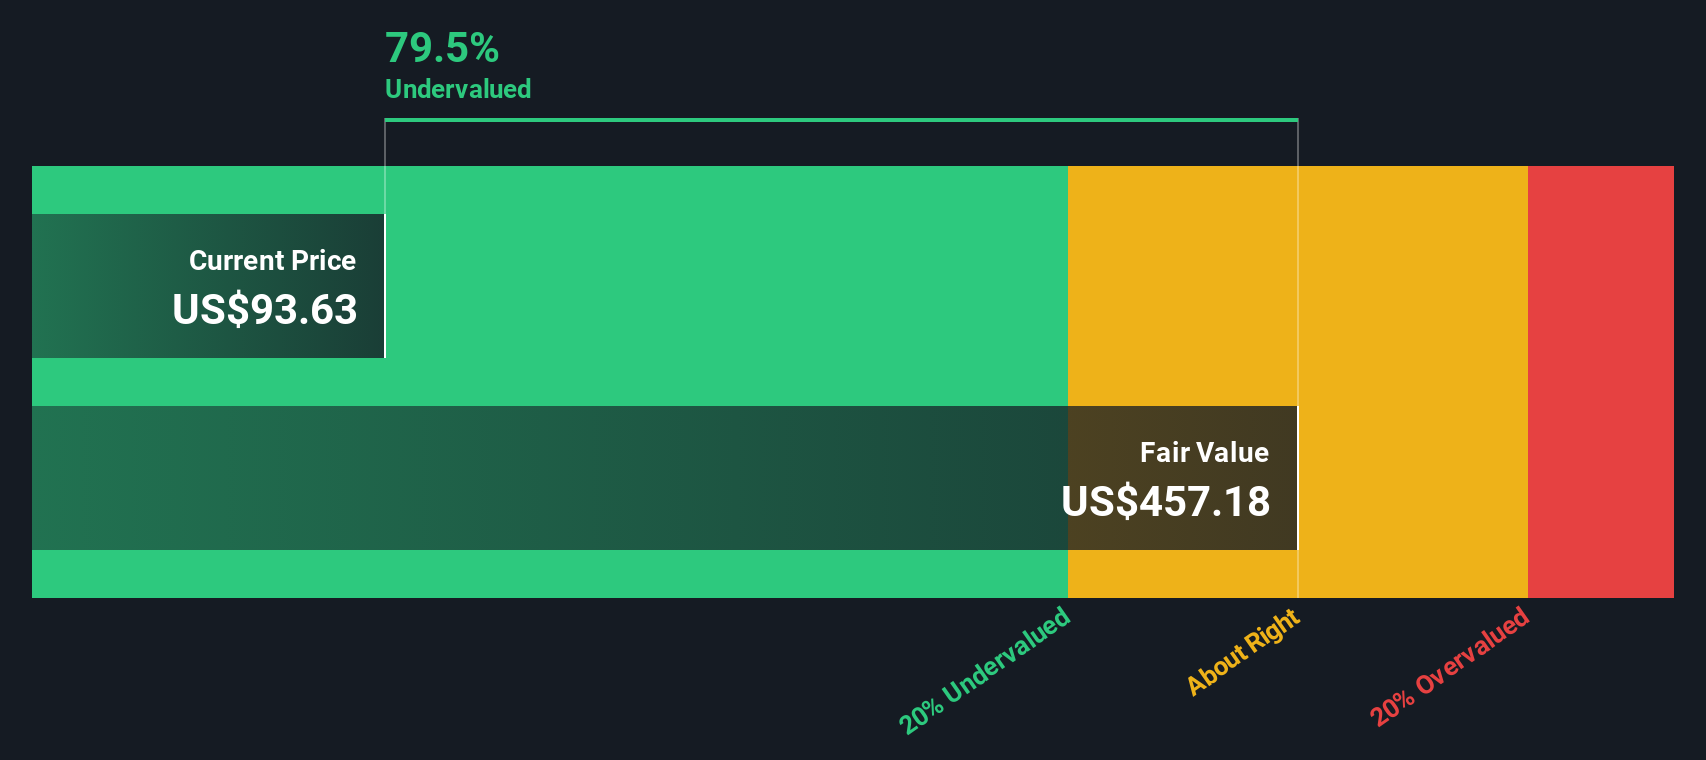
Putting this together, the DCF model arrives at an estimated intrinsic value of about $491.34 per share, compared with a current share price of roughly $113.94. On these inputs, the stock screens as about 76.8% undervalued.
Result: UNDERVALUED
Our Discounted Cash Flow (DCF) analysis suggests Bunge Global is undervalued by 76.8%. Track this in your watchlist or portfolio, or discover 55 more high quality undervalued stocks.
Approach 2: Bunge Global Price vs Earnings
For profitable companies, the P/E ratio is a handy shorthand for what you are paying for each dollar of earnings. It is therefore a useful cross check against the DCF outcome you saw above.
What counts as a “normal” P/E depends on how the market views a company’s growth potential and risk profile. Higher expected growth or lower perceived risk can justify a higher P/E, while lower growth or higher risk tends to align with a lower one.
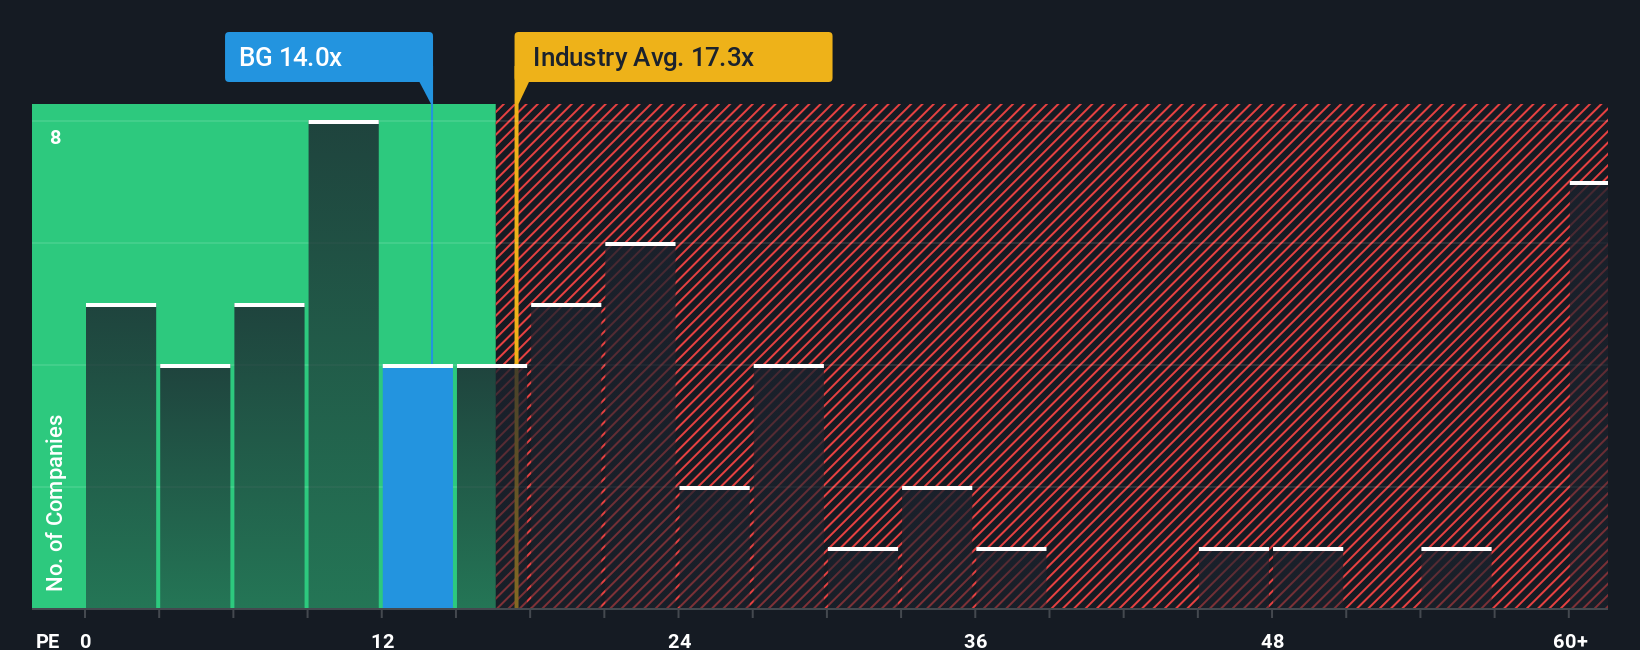
Bunge Global currently trades on a P/E of 26.91x. That sits above the Food industry average of 22.81x, but below the peer group average of 33.15x. Simply Wall St also provides a proprietary “Fair Ratio” of 42.68x, which is the P/E it would expect for Bunge Global after factoring in elements such as its earnings growth profile, margins, industry, market cap and risk indicators.
This Fair Ratio is designed to be more tailored than a simple comparison with industry or peer averages, because it tries to adjust for company specific characteristics rather than treating all Food companies the same.
Since the Fair Ratio of 42.68x is higher than the current P/E of 26.91x, this framework indicates that Bunge Global is trading below the level implied by those fundamentals.
Result: UNDERVALUED
P/E ratios tell one story, but what if the real opportunity lies elsewhere? Start investing in legacies, not executives. Discover our 22 top founder-led companies.
Upgrade Your Decision Making: Choose your Bunge Global Narrative
Earlier we mentioned that there is an even better way to understand valuation, so let us introduce you to Narratives, which are simply your own story about Bunge Global linked directly to the numbers you think are reasonable for its future revenue, earnings, margins and fair value.
A Narrative connects three pieces in one place: the business story you believe in, the financial forecast that flows from that story, and the fair value that those cash flows and assumptions imply.
On Simply Wall St’s Community page, which is used by millions of investors, Narratives are built into the platform so you can quickly compare your assumed fair value with the current share price and decide whether Bunge Global looks like a buy, a hold or a potential sell for you. The Narrative then automatically refreshes when new information such as news or earnings is added.
For example, one investor might build a cautious Bunge Global Narrative with conservative revenue growth and a modest fair value, while another uses higher long term margins and arrives at a much higher fair value, yet both are using the same structure to turn their view of the company into clear numbers they can act on.
Do you think there's more to the story for Bunge Global? Head over to our Community to see what others are saying!
This article by Simply Wall St is general in nature. We provide commentary based on historical data and analyst forecasts only using an unbiased methodology and our articles are not intended to be financial advice. It does not constitute a recommendation to buy or sell any stock, and does not take account of your objectives, or your financial situation. We aim to bring you long-term focused analysis driven by fundamental data. Note that our analysis may not factor in the latest price-sensitive company announcements or qualitative material. Simply Wall St has no position in any stocks mentioned.
Have feedback on this article? Concerned about the content? Get in touch with us directly. Alternatively, email editorial-team@simplywallst.com