

A Look At PJT Partners (PJT) Valuation After Mixed Q4 Results And Record Annual Revenue
What triggered the latest move in PJT Partners stock?
PJT Partners (PJT) just reported record annual revenue and an earnings beat for the fourth quarter, while missing quarterly revenue expectations. This combination left investors weighing growth concerns against clear profitability and business strength.
See our latest analysis for PJT Partners.
The latest Q4 announcement, dividend declaration and update on share repurchases came against a weaker tape, with a 1 month share price return decline of 12.65% and a 1 year total shareholder return decline of 9.9%. However, the 3 year and 5 year total shareholder returns of 115.58% and 133.41% still point to gains that longer term holders have experienced, suggesting recent momentum has cooled after a strong multi year run.
If mixed earnings reactions have you rethinking where you hunt for opportunities, it could be worth scanning our list of 22 top founder-led companies as a fresh set of ideas.
PJT now trades at $158.47 after a sharp pullback, even as it reports record revenue, higher earnings and ongoing buybacks and dividends. This raises a key question: is this weakness a chance to buy in, or is the market already pricing in further growth?
Preferred P/E of 21.4x: Is it justified?
On a P/E of 21.4x at a last close of $158.47, PJT Partners is priced a little below the broader US Capital Markets industry but above its closer peer set. This leaves the valuation sitting in a middle ground rather than looking clearly cheap or stretched.
The P/E ratio shows how much investors are currently paying for each dollar of earnings, which matters for an advisory-focused firm like PJT that is already profitable and not in an early-stage, loss-making phase. With earnings growing 34% over the past year and 8.1% per year over the past 5 years, a P/E in the low 20s indicates the market is attaching a premium to those earnings compared with lower-growth financial names, but not an extreme premium relative to the wider industry.
Compared with the US Capital Markets industry average P/E of 22.8x, PJT appears slightly cheaper. This suggests investors are not paying as much as they are for the sector overall. However, against its closer peer group, where the average P/E is 16.1x, PJT looks more expensive. This implies the market is willing to pay more for its high return on equity of 33.3%, higher net profit margin of 10.5%, and high-quality earnings. This split comparison points to a P/E that many investors may see as justified by profitability and growth, but not a bargain.
See what the numbers say about this price — find out in our valuation breakdown.
Result: Price-to-earnings of 21.4x (ABOUT RIGHT)
However, recent share price declines and the current premium to peers on a P/E basis could limit upside if revenue growth or profitability momentum softens from this point.
Find out about the key risks to this PJT Partners narrative.
Another view on valuation: DCF sends a different message
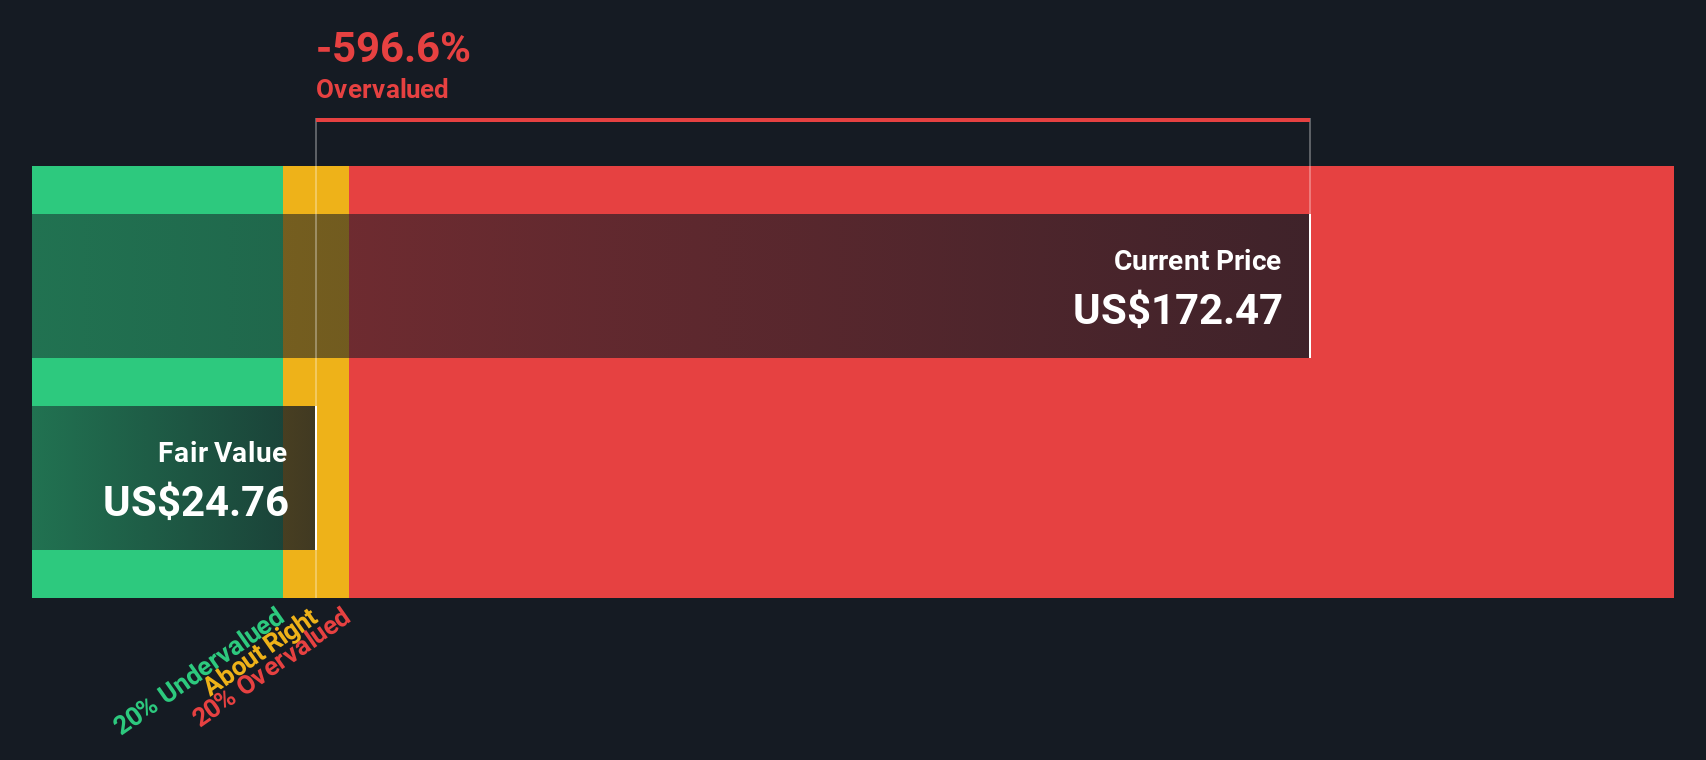
While the P/E of 21.4x suggests PJT Partners is roughly in line with the wider US Capital Markets group, our DCF model presents a far tougher picture, with an estimated future cash flow value of $28.40 versus a share price of $158.47. That gap casts the recent pullback in a very different light, so which story do you trust more: the earnings multiple or the cash flow model?
Look into how the SWS DCF model arrives at its fair value.
Simply Wall St performs a discounted cash flow (DCF) on every stock in the world every day (check out PJT Partners for example). We show the entire calculation in full. You can track the result in your watchlist or portfolio and be alerted when this changes, or use our stock screener to discover 55 high quality undervalued stocks. If you save a screener we even alert you when new companies match - so you never miss a potential opportunity.
Build Your Own PJT Partners Narrative
If this view does not quite match your own, or you prefer to rely on your own work, you can build a complete thesis in minutes by starting with Do it your way.
A good starting point is our analysis highlighting 2 key rewards investors are optimistic about regarding PJT Partners.
Looking for more investment ideas?
If PJT has sharpened your focus on quality, do not stop here. The right watchlist can start with a few well chosen ideas from a consistent process.
- Start building a value focused shortlist by checking companies on our 55 high quality undervalued stocks that pair quality fundamentals with prices that may not fully reflect them.
- Strengthen your income stream by scanning the 15 dividend fortresses that highlight companies offering higher yields with a focus on resilience.
- Reduce portfolio stress by reviewing our 81 resilient stocks with low risk scores that flag businesses with steadier risk profiles and more durable financials.
This article by Simply Wall St is general in nature. We provide commentary based on historical data and analyst forecasts only using an unbiased methodology and our articles are not intended to be financial advice. It does not constitute a recommendation to buy or sell any stock, and does not take account of your objectives, or your financial situation. We aim to bring you long-term focused analysis driven by fundamental data. Note that our analysis may not factor in the latest price-sensitive company announcements or qualitative material. Simply Wall St has no position in any stocks mentioned.
Have feedback on this article? Concerned about the content? Get in touch with us directly. Alternatively, email editorial-team@simplywallst.com