

Is Victory Capital (VCTR) Fairly Priced After Recent Share Price Gains?
- If you are wondering whether Victory Capital Holdings at US$71.25 is offering fair value or a potential bargain, you are in the right place because this article focuses squarely on what the current price might be implying.
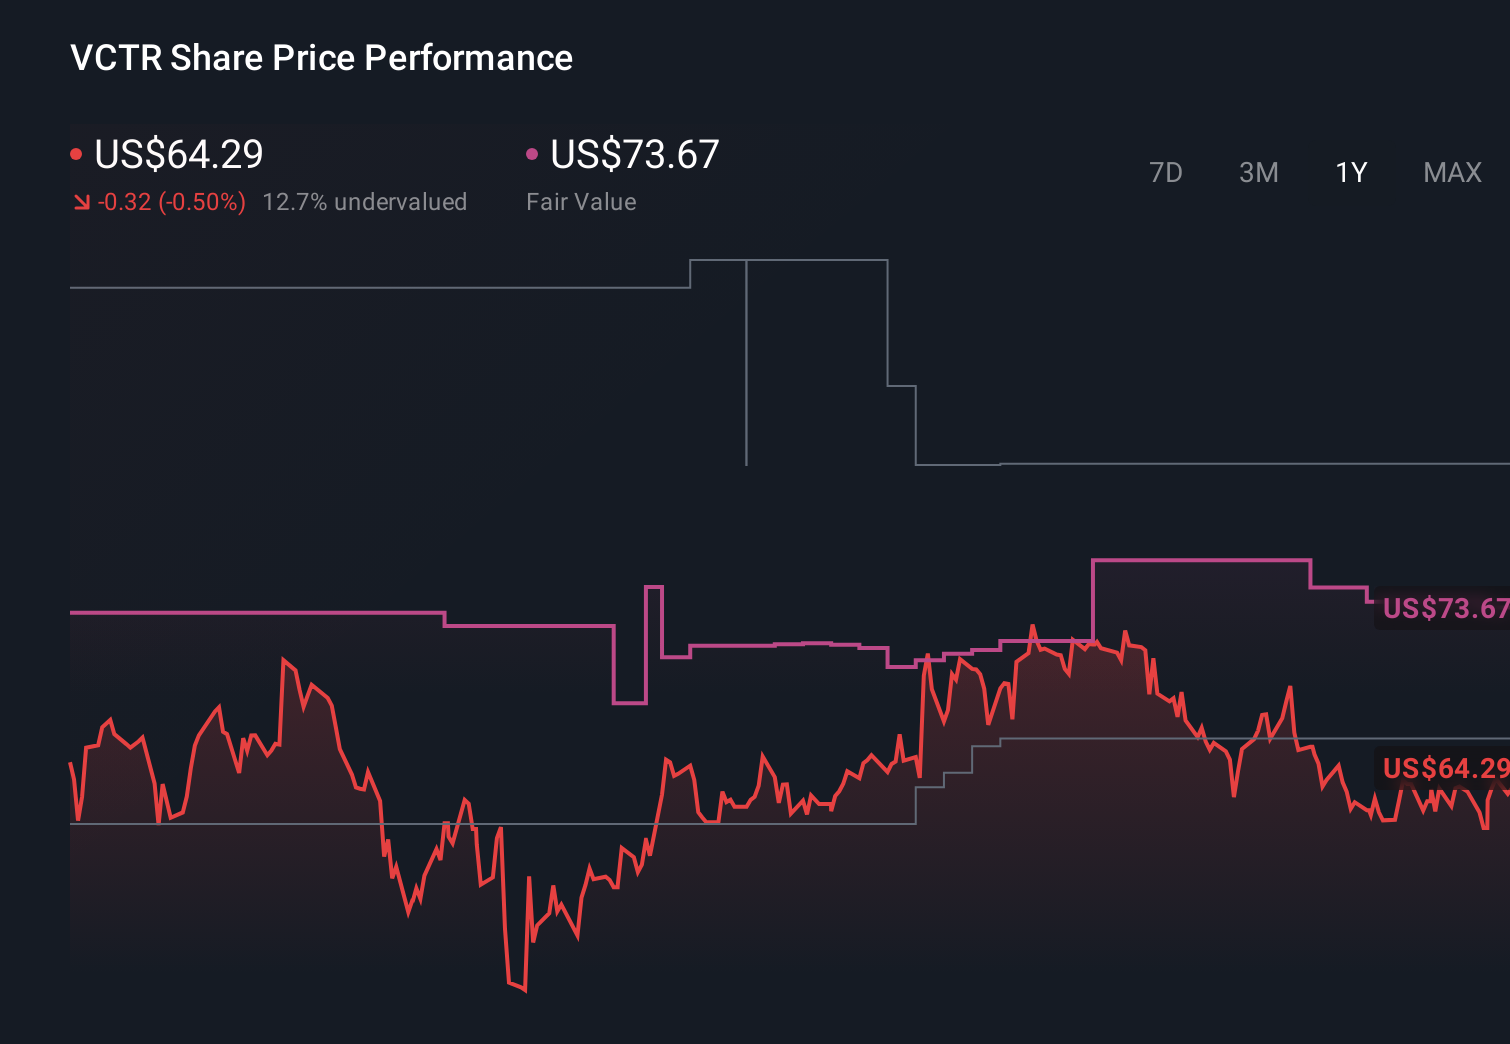
- The stock has recent returns of 1.0% over 7 days, 7.9% over 30 days, 11.2% year to date and 3.9% over the past year, which raises the question of how these moves line up with what the business might be worth.
- Investors have been paying close attention to company specific developments and broader asset management industry news, which can reshape expectations about future cash flows and risk. These shifts in sentiment often feed into how the market prices an asset manager like Victory Capital Holdings, even when underlying fundamentals move more slowly.
- On our simple valuation checklist, Victory Capital Holdings scores 3 out of 6. Next we will look at the usual valuation tools such as P/E, cash flow based models and peer comparisons, before finishing with a more comprehensive way to think about what valuation really means for long term investors.
Approach 1: Victory Capital Holdings Excess Returns Analysis
The Excess Returns model looks at how much profit a company is expected to generate above the return that equity investors typically require, then links that to the value of its equity per share. Instead of focusing on near term earnings alone, it weighs the company’s return on equity against its cost of equity.
For Victory Capital Holdings, the model uses a book value of $37.79 per share and a stable EPS estimate of $4.13 per share, based on the median return on equity from the past 5 years. The average return on equity used in the model is 23.82%, while the cost of equity is set at $1.44 per share. That leaves an excess return of $2.69 per share, which is the amount the business is modeled to earn above its equity cost. A stable book value of $17.33 per share, sourced from the median book value over the past 5 years, anchors the calculation.
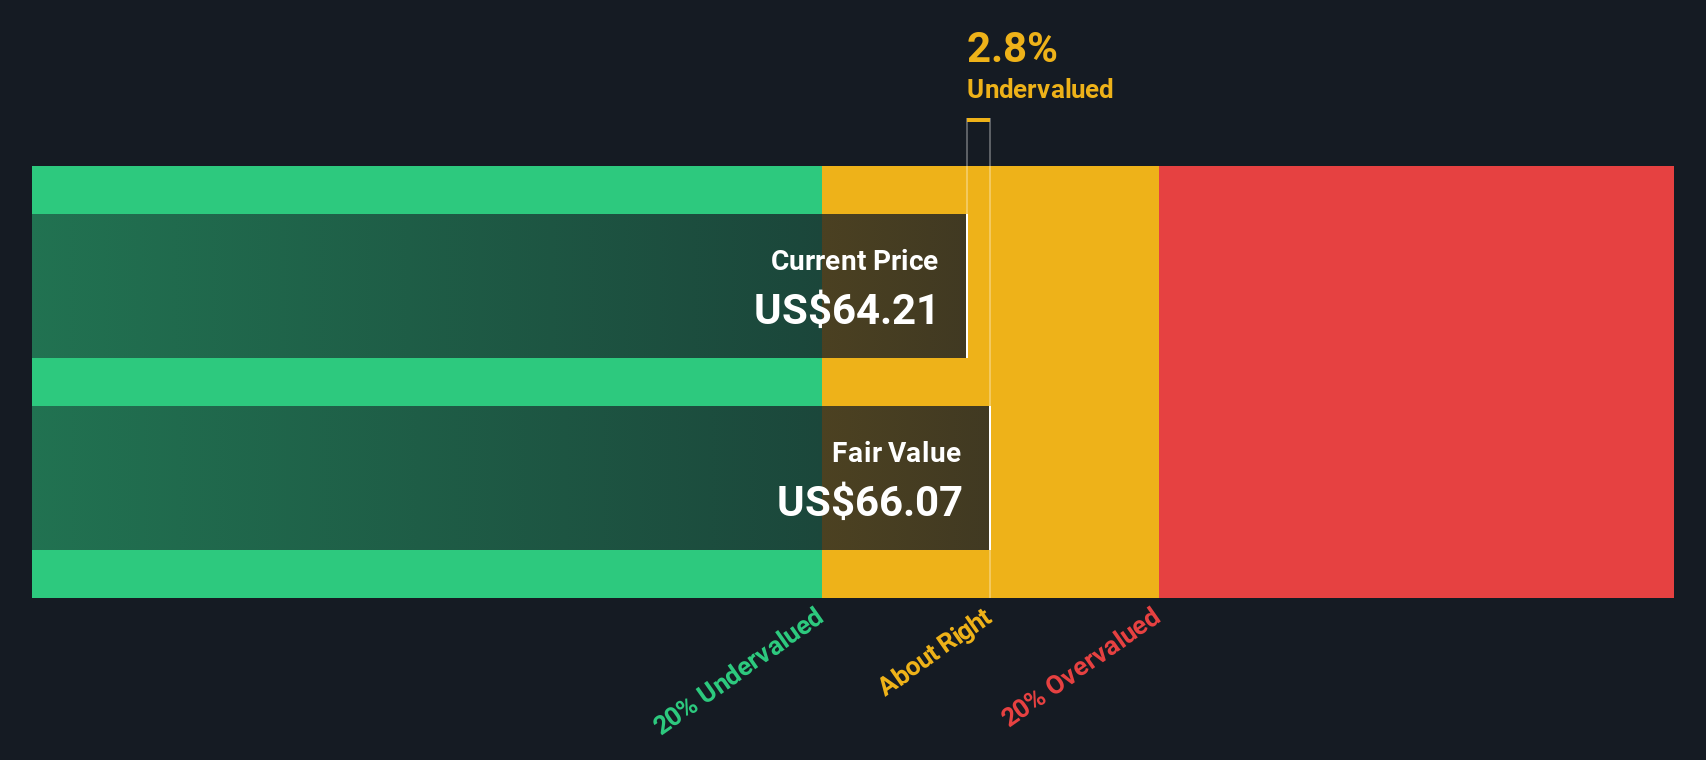
Bringing these inputs together, the Excess Returns model points to an intrinsic value of about $72.36 per share, which is roughly 1.5% above the current price of $71.25. On this basis, the stock appears close to fairly priced, with a slight tilt to the cheap side.
Result: ABOUT RIGHT
Victory Capital Holdings is fairly valued according to our Excess Returns, but this can change at a moment's notice. Track the value in your watchlist or portfolio and be alerted on when to act.
Approach 2: Victory Capital Holdings Price vs Earnings
For a profitable company like Victory Capital Holdings, the P/E ratio is a useful yardstick because it links what you pay per share to what the business is currently earning per share. It lets you see how much the market is willing to pay for each dollar of earnings.
In practice, a higher P/E usually reflects higher growth expectations or lower perceived risk, while a lower P/E tends to signal more modest growth assumptions or higher perceived risk. The question is not whether a P/E is high or low in isolation, but whether it fits the company’s earnings profile and risk level.
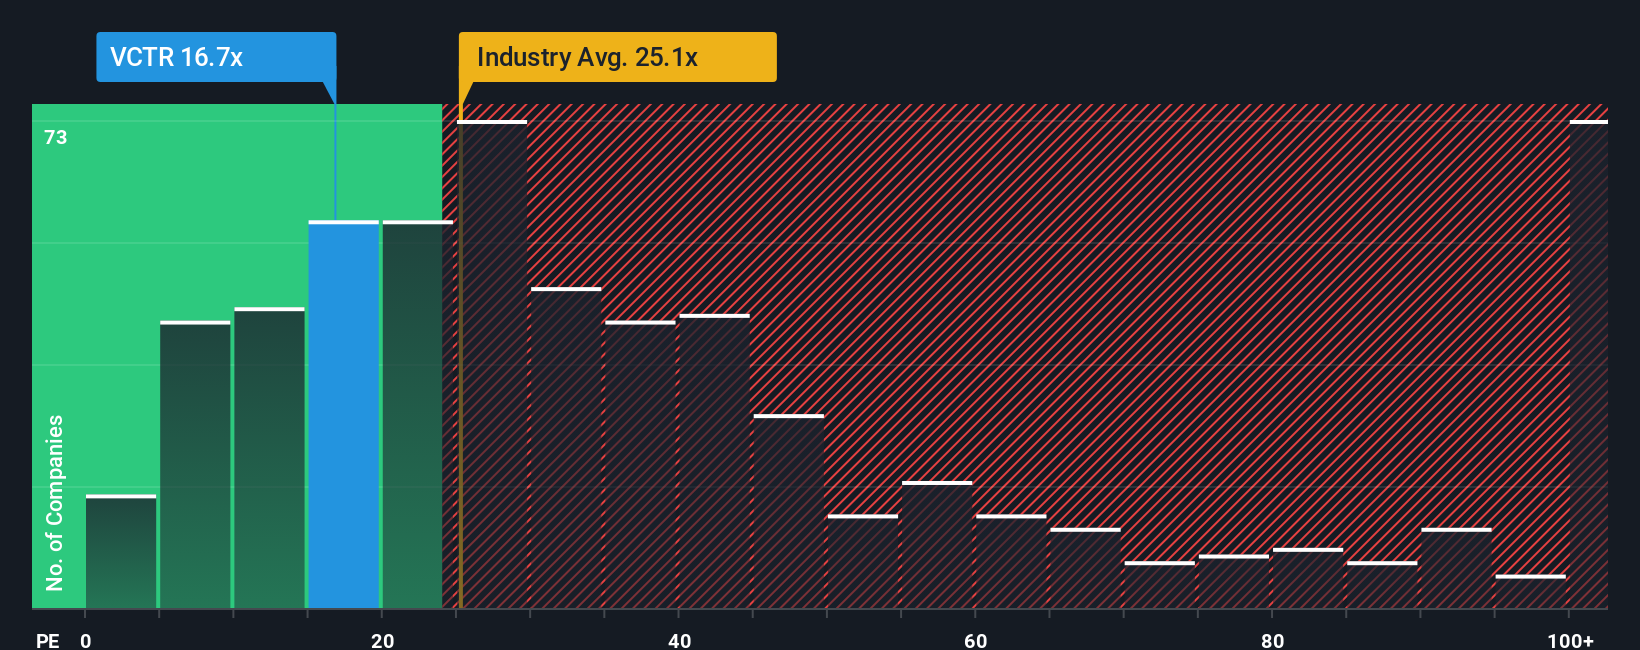
Victory Capital Holdings currently trades on a P/E of 16.92x, compared with a peer average of 12.97x and a Capital Markets industry average of 23.14x. Simply Wall St’s Fair Ratio for the company is 19.52x. The Fair Ratio is a proprietary estimate of what the P/E could be given factors such as earnings growth, profit margin, industry, market value and company specific risks. Because it folds these elements into a single figure, it can be a more tailored reference point than a simple comparison with peers or the broad industry. With the actual P/E below the Fair Ratio, the shares screen as potentially undervalued on this metric.
Result: UNDERVALUED
P/E ratios tell one story, but what if the real opportunity lies elsewhere? Start investing in legacies, not executives. Discover our 22 top founder-led companies.
Upgrade Your Decision Making: Choose your Victory Capital Holdings Narrative
Earlier we mentioned that there is an even better way to understand valuation, so let us introduce you to Narratives. A Narrative is your story about a company, where you spell out what you think is a reasonable fair value, plus your expectations for future revenue, earnings and profit margins, instead of just relying on headline ratios. Narratives link that story to a simple financial forecast, then to a fair value estimate, so you can clearly compare what you think the shares are worth with the current market price. On Simply Wall St, within the Community page used by millions of investors, Narratives are an easy tool you can adjust as new information, such as news or earnings updates, becomes available, and they update automatically when the data changes. This helps you decide whether Victory Capital Holdings looks attractive, fairly priced or expensive, based on your own assumptions rather than someone else’s. For example, one Victory Capital Holdings Narrative on the Community page may assume very cautious revenue growth and arrive at a lower fair value, while another may assume stronger margins and a higher fair value, yet both are grounded in a clear, transparent story and model.
Do you think there's more to the story for Victory Capital Holdings? Head over to our Community to see what others are saying!
This article by Simply Wall St is general in nature. We provide commentary based on historical data and analyst forecasts only using an unbiased methodology and our articles are not intended to be financial advice. It does not constitute a recommendation to buy or sell any stock, and does not take account of your objectives, or your financial situation. We aim to bring you long-term focused analysis driven by fundamental data. Note that our analysis may not factor in the latest price-sensitive company announcements or qualitative material. Simply Wall St has no position in any stocks mentioned.
Have feedback on this article? Concerned about the content? Get in touch with us directly. Alternatively, email editorial-team@simplywallst.com