

Is Navan (NAVN) Pricing Reflecting Reality After The Recent 40% Monthly Share Price Slide
- Wondering if Navan’s share price really lines up with what the business could be worth, or if the recent pullback is telling you something different about its value?
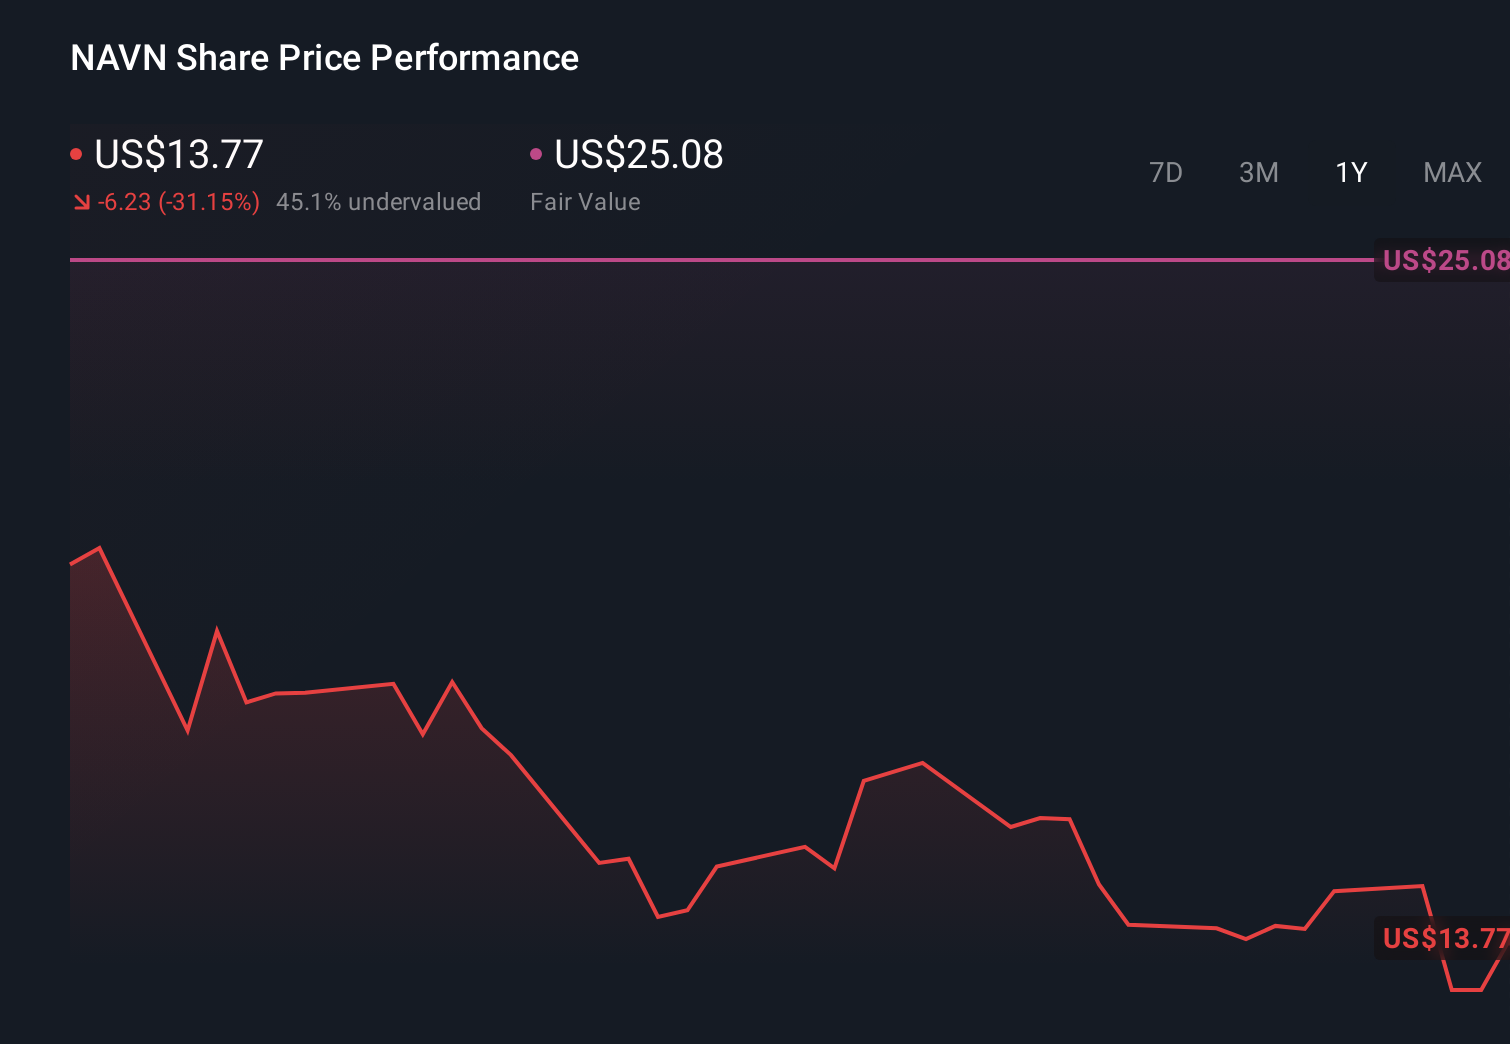
- Navan last closed at US$10.85, with the share price showing a 5.5% decline over the past week and a 39.9% decline over the past month, contributing to a 33.2% decline year to date.
- Recent coverage has focused on Navan’s position in the consumer services space and how investors are reassessing growth expectations and risk after the sharp month long pullback. This backdrop is important context for anyone weighing whether the current price reflects short term sentiment or a deeper shift in how the company is being valued.
- On Simply Wall St’s valuation checks, Navan scores 3 out of 6 for potential undervaluation, as shown in its valuation score. Next, we will walk through what different valuation approaches say about that number before looking at an even more rounded way to think about value toward the end of the article.
Approach 1: Navan Discounted Cash Flow (DCF) Analysis
A Discounted Cash Flow, or DCF, model takes estimates of the cash a company could generate in the future and discounts those back into today’s dollars to arrive at an estimate of what the business might be worth now.
For Navan, the model used is a 2 Stage Free Cash Flow to Equity approach, based on cash flow projections expressed in US$. The latest twelve month free cash flow is a loss of about US$10.25 million. Analysts and extrapolations then project free cash flow shifting to positive territory, reaching US$173.89 million in 2031, with a series of annual projections in between that are discounted back to today’s value.
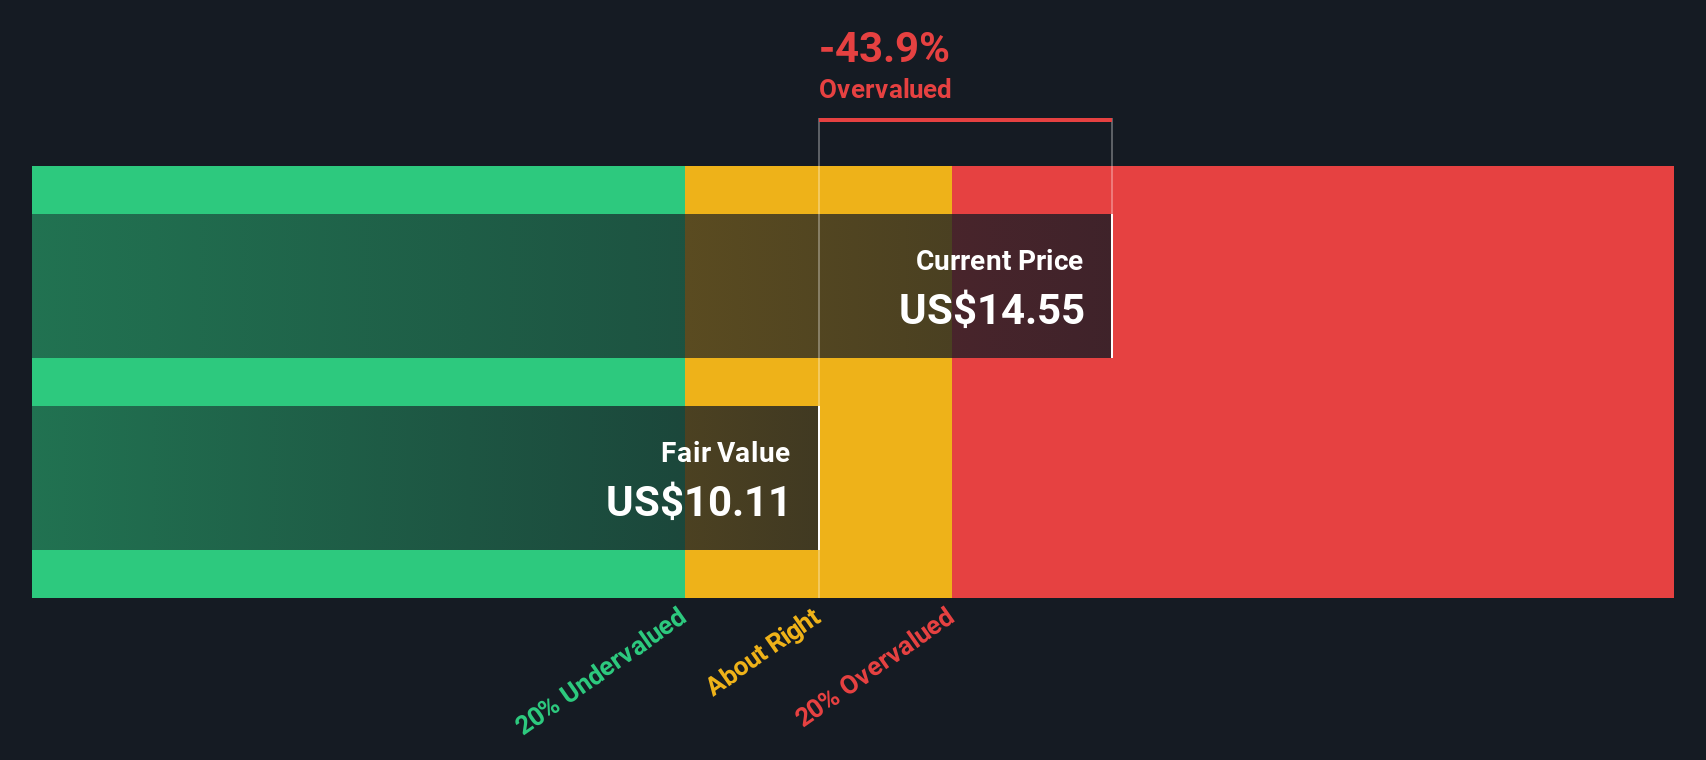
Putting all those discounted cash flows together gives an estimated intrinsic value of US$14.87 per share. Compared with the recent share price of US$10.85, the DCF points to an implied 27.1% discount, which suggests the market price is below this cash flow based estimate of value.
Result: UNDERVALUED
Our Discounted Cash Flow (DCF) analysis suggests Navan is undervalued by 27.1%. Track this in your watchlist or portfolio, or discover 53 more high quality undervalued stocks.
Approach 2: Navan Price vs Sales
For companies where earnings are not yet a steady guide, the price to sales, or P/S, ratio is often a useful way to think about value because it compares what investors are paying to the revenue the business is already generating.
What counts as a reasonable P/S ratio usually reflects what the market thinks about two things: how quickly revenue could grow over time and how risky those future sales are. Higher expected growth and lower perceived risk can justify a higher multiple, while slower growth or higher uncertainty tend to pull it down.
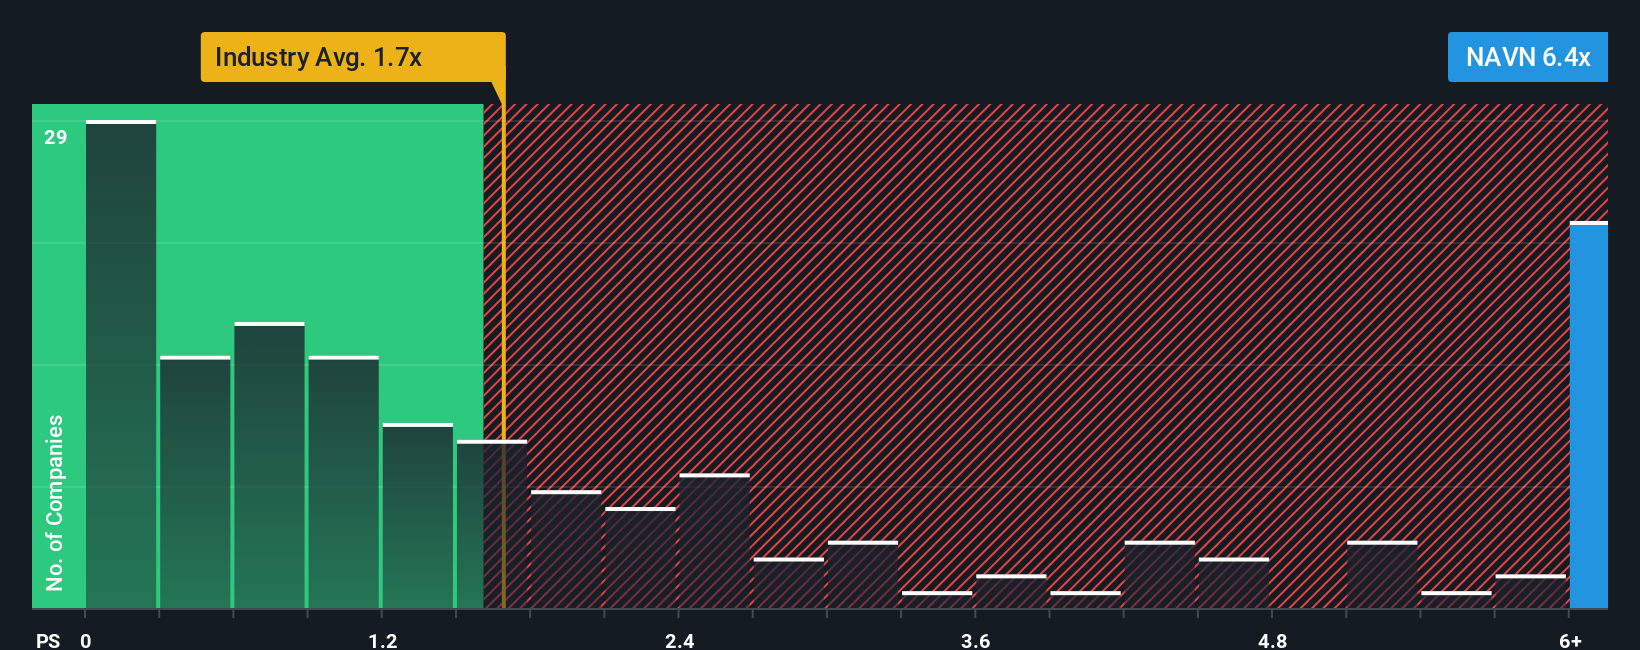
Navan currently trades on a P/S ratio of 4.11x. That sits above the Hospitality industry average P/S of 1.70x and above the peer group average of 2.35x. Simply Wall St’s Fair Ratio is a proprietary estimate of what P/S you might expect for Navan, after considering its earnings profile, revenue growth outlook, profit margins, industry, market cap and specific risks. This tailored Fair Ratio can be more useful than a simple industry or peer comparison because those broad groups often mix companies with very different business models and risk levels.
As the Fair Ratio for Navan is not available, we cannot draw a firm conclusion here about whether the current P/S looks high, low or about right.
Result: ABOUT RIGHT
P/S ratios tell one story, but what if the real opportunity lies elsewhere? Start investing in legacies, not executives. Discover our 22 top founder-led companies.
Upgrade Your Decision Making: Choose your Navan Narrative
Earlier we mentioned that there is an even better way to understand valuation, so let us introduce you to Narratives, which are simply your story about a company tied directly to your view of its fair value, future revenue, earnings and margins.
On Simply Wall St’s Community page, you can set up a Narrative for Navan that connects what you believe about its business to a clear financial forecast and then to a fair value estimate you can compare with today’s share price.
Narratives are designed to be easy to use, and they update automatically when fresh information comes in, such as new earnings releases or major news, so your view of fair value stays aligned with the latest data without you having to rebuild your model every time.
For example, one investor might set a higher fair value for Navan if they expect stronger revenue and margin outcomes, while another might choose a lower fair value based on more cautious assumptions, and both Narratives will keep refreshing as new information arrives.
Do you think there's more to the story for Navan? Head over to our Community to see what others are saying!
This article by Simply Wall St is general in nature. We provide commentary based on historical data and analyst forecasts only using an unbiased methodology and our articles are not intended to be financial advice. It does not constitute a recommendation to buy or sell any stock, and does not take account of your objectives, or your financial situation. We aim to bring you long-term focused analysis driven by fundamental data. Note that our analysis may not factor in the latest price-sensitive company announcements or qualitative material. Simply Wall St has no position in any stocks mentioned.
Have feedback on this article? Concerned about the content? Get in touch with us directly. Alternatively, email editorial-team@simplywallst.com