

Is Revvity (RVTY) Pricing Reflect Its Mixed Returns And Cash Flow Potential
- If you are wondering whether Revvity is offering fair value at its current share price, this article walks through what the numbers are really saying.
- The stock closed at US$101.59, with returns of a 6.6% decline over 7 days, a 1.4% decline over 30 days, a 3.5% gain year to date, and a 14.3% decline over 1 year. Taken together, this gives you a mixed picture of sentiment and risk.
- Recent coverage of Revvity has focused on its position in the pharmaceuticals and biotech space and how the business fits into broader health care trends. This context helps explain why the share price has moved unevenly over different time frames.
- Right now, Revvity scores 3 out of 6 on our valuation checks. Next we will walk through the different valuation approaches behind that score and hint at a more complete way to think about value that we will come back to at the end.
Find out why Revvity's -14.3% return over the last year is lagging behind its peers.
Approach 1: Revvity Discounted Cash Flow (DCF) Analysis
A DCF model takes estimates of a company’s future cash flows, then discounts them back to today’s dollars to estimate what the whole business might be worth right now.
For Revvity, the model uses a 2 Stage Free Cash Flow to Equity approach. The latest twelve month free cash flow is about $500.4 million. Analysts provide explicit free cash flow estimates for the earlier years, and Simply Wall St then extrapolates further out, with projected free cash flow reaching $1.09 billion in 2035 based on the ten year projections supplied.
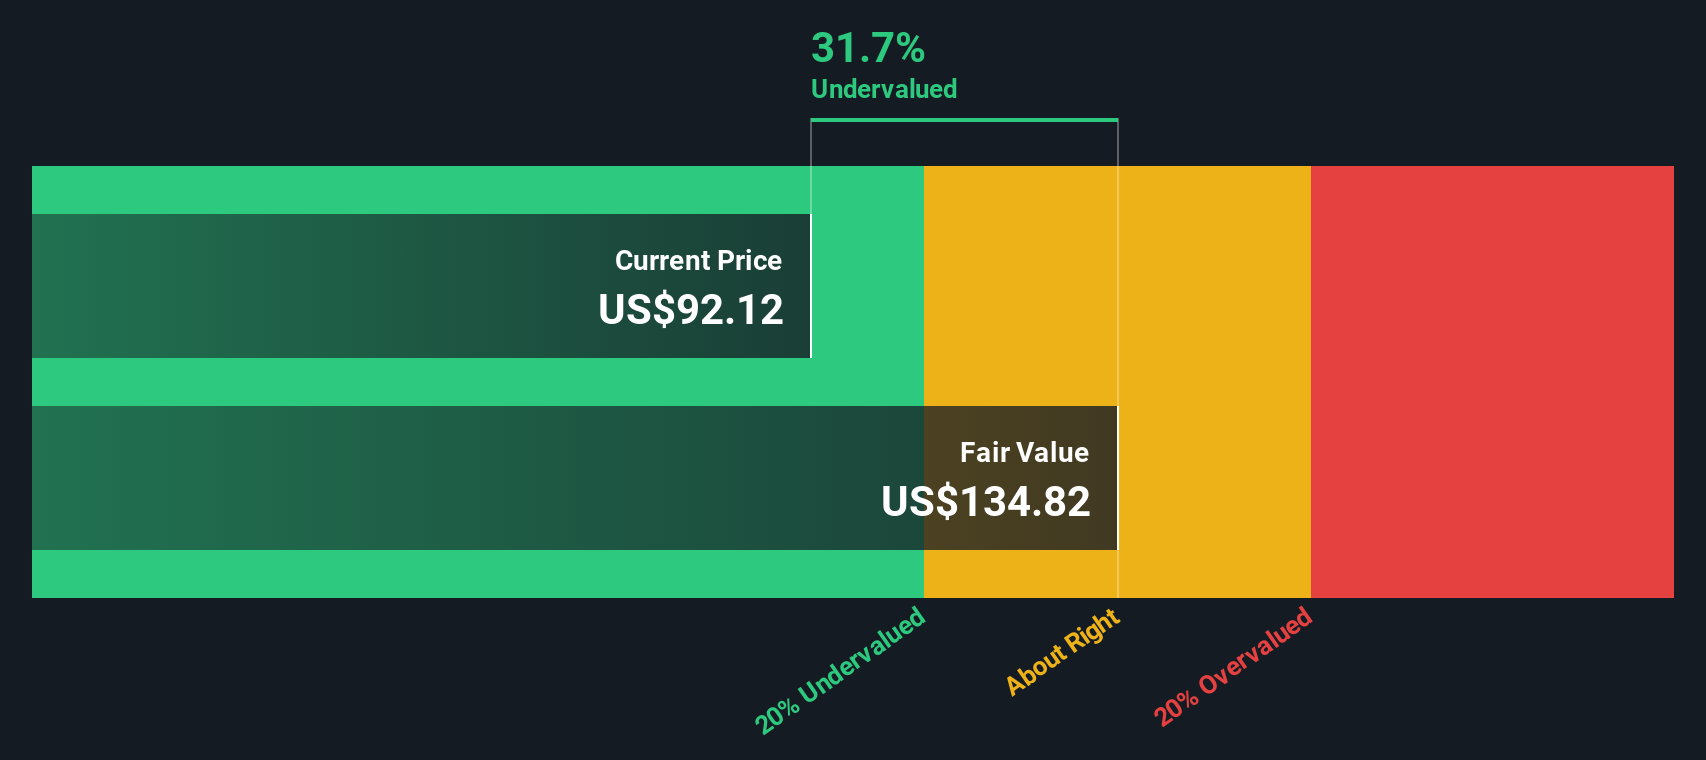
Pulling these cash flows together and discounting them, the model arrives at an estimated intrinsic value of about $137.95 per share. Compared with the recent share price of $101.59, this suggests the stock is trading at a discount of around 26.4% according to this DCF framework.
Result: UNDERVALUED
Our Discounted Cash Flow (DCF) analysis suggests Revvity is undervalued by 26.4%. Track this in your watchlist or portfolio, or discover 53 more high quality undervalued stocks.
Approach 2: Revvity Price vs Earnings
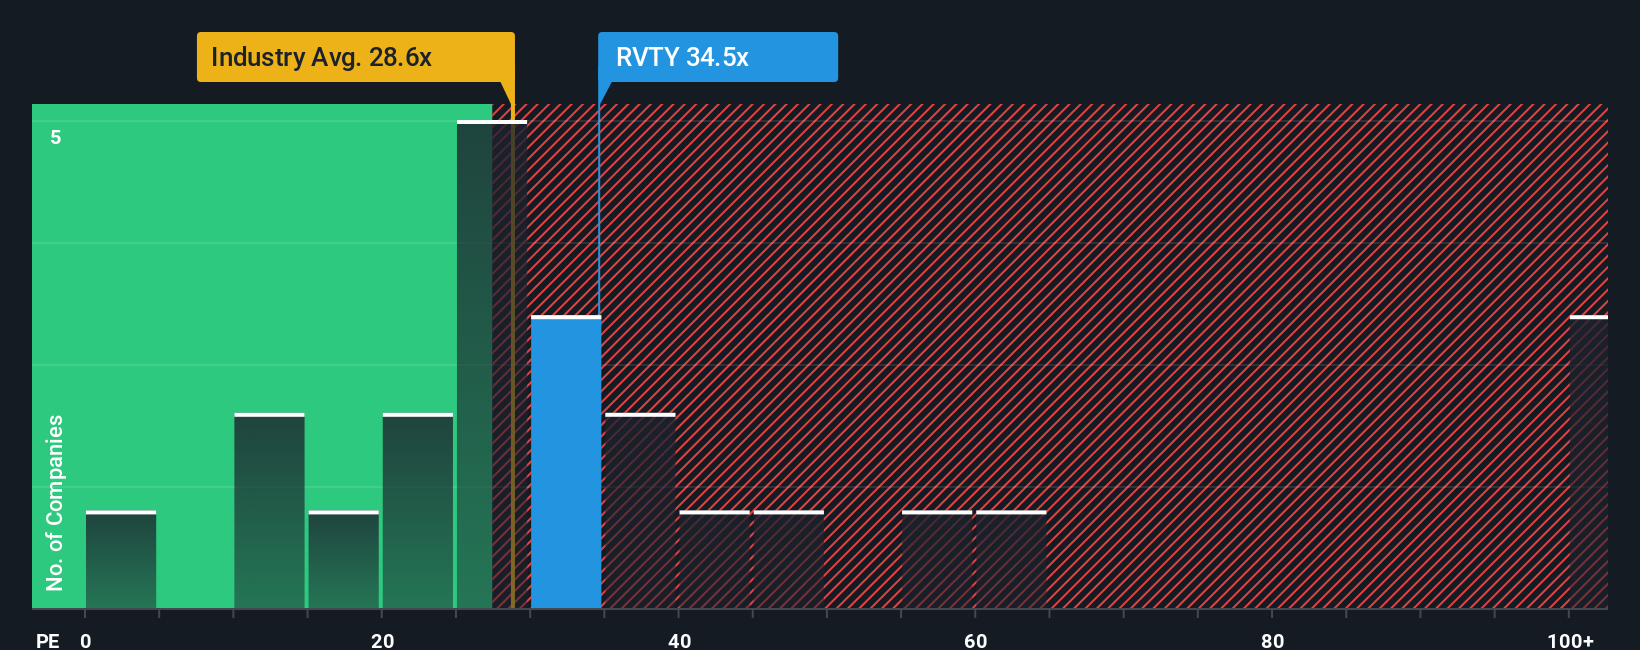
For a profitable company like Revvity, the P/E ratio is a useful way to see how much investors are paying for each dollar of earnings. A higher P/E often reflects expectations of stronger future growth or a lower perceived risk, while a lower P/E can point to more muted expectations or higher uncertainty.
Revvity currently trades on a P/E of 48.0x. That sits above the Life Sciences industry average P/E of 36.5x and below the peer group average of 52.3x, so the stock is priced somewhere between the broader industry and closer peers. To refine this, Simply Wall St uses a “Fair Ratio”, which estimates what P/E might make sense for Revvity given its earnings growth profile, industry, profit margins, market cap and risk factors. This Fair Ratio for Revvity is 24.9x.
The Fair Ratio is more tailored than a simple comparison with industry or peer averages because it adjusts for company specific traits rather than treating all firms as equal. Comparing 24.9x to the current 48.0x suggests the shares trade on a higher multiple than this model implies.
Result: OVERVALUED
P/E ratios tell one story, but what if the real opportunity lies elsewhere? Start investing in legacies, not executives. Discover our 22 top founder-led companies.
Upgrade Your Decision Making: Choose your Revvity Narrative
Earlier we mentioned that there is an even better way to understand valuation, so let us introduce you to Narratives, which simply means you attach a clear story about Revvity’s future to the numbers you are using for fair value, revenue, earnings and margins.
A Narrative links what you believe about the business to a financial forecast and then to a fair value estimate, so instead of just looking at a DCF or P/E in isolation, you see how your assumptions flow through to a single number you can compare with the current share price.
On Simply Wall St, Narratives sit inside the Community page and are designed to be easy to use, so you can adjust assumptions, see a fair value update in real time, and compare that with today’s price to help you decide whether the stock looks attractive, fully priced or expensive to you.
Because Narratives refresh when new information such as earnings releases or major news is added, different investors can end up with very different stories for Revvity. For example, one Narrative might reflect a very optimistic fair value with higher margins, and another might use more cautious revenue and profit assumptions that lead to a lower valuation.
Do you think there's more to the story for Revvity? Head over to our Community to see what others are saying!

This article by Simply Wall St is general in nature. We provide commentary based on historical data and analyst forecasts only using an unbiased methodology and our articles are not intended to be financial advice. It does not constitute a recommendation to buy or sell any stock, and does not take account of your objectives, or your financial situation. We aim to bring you long-term focused analysis driven by fundamental data. Note that our analysis may not factor in the latest price-sensitive company announcements or qualitative material. Simply Wall St has no position in any stocks mentioned.
Have feedback on this article? Concerned about the content? Get in touch with us directly. Alternatively, email editorial-team@simplywallst.com