

Is It Too Late To Consider Forestar Group (FOR) After Strong Recent Share Price Gains
- Wondering if Forestar Group at around US$29.27 is offering genuine value or if the easy gains are already behind it? This article walks through the key numbers so you can judge the price with more confidence.
- The stock has delivered returns of 12.5% over 7 days, 6.8% over 30 days, 20.4% year to date, 27.8% over 1 year and a very large 3 year gain. This naturally raises questions about how much of the good news might already be reflected in the share price.
- Recent price moves are set against an ongoing focus on Forestar Group as a listed residential lot developer, with investors paying closer attention to how its land and development pipeline are being valued by the market. Broader sector headlines around housing demand, borrowing costs and land availability also help frame how investors may be thinking about risk and potential for this type of business.
- On our valuation checklist, Forestar Group scores 3 out of 6 possible points for being undervalued. Next we will walk through the usual approaches like P/E, asset based measures and cash flow models, before finishing with a more holistic way to think about what that score really means for you.
Approach 1: Forestar Group Discounted Cash Flow (DCF) Analysis
A Discounted Cash Flow, or DCF, model takes forecasts of a company’s future cash flows and discounts them back to today’s dollars, aiming to estimate what the whole business might be worth right now.
For Forestar Group, the model used is a 2 Stage Free Cash Flow to Equity approach, based on Free Cash Flow, or FCF, available to shareholders. The latest twelve month FCF is about $93.24 million. Analysts provide estimates out to 2027, with Simply Wall St extrapolating further so that projected FCF in 2035 is $11.38 million, all in US dollars and already adjusted for the time value of money in the model.
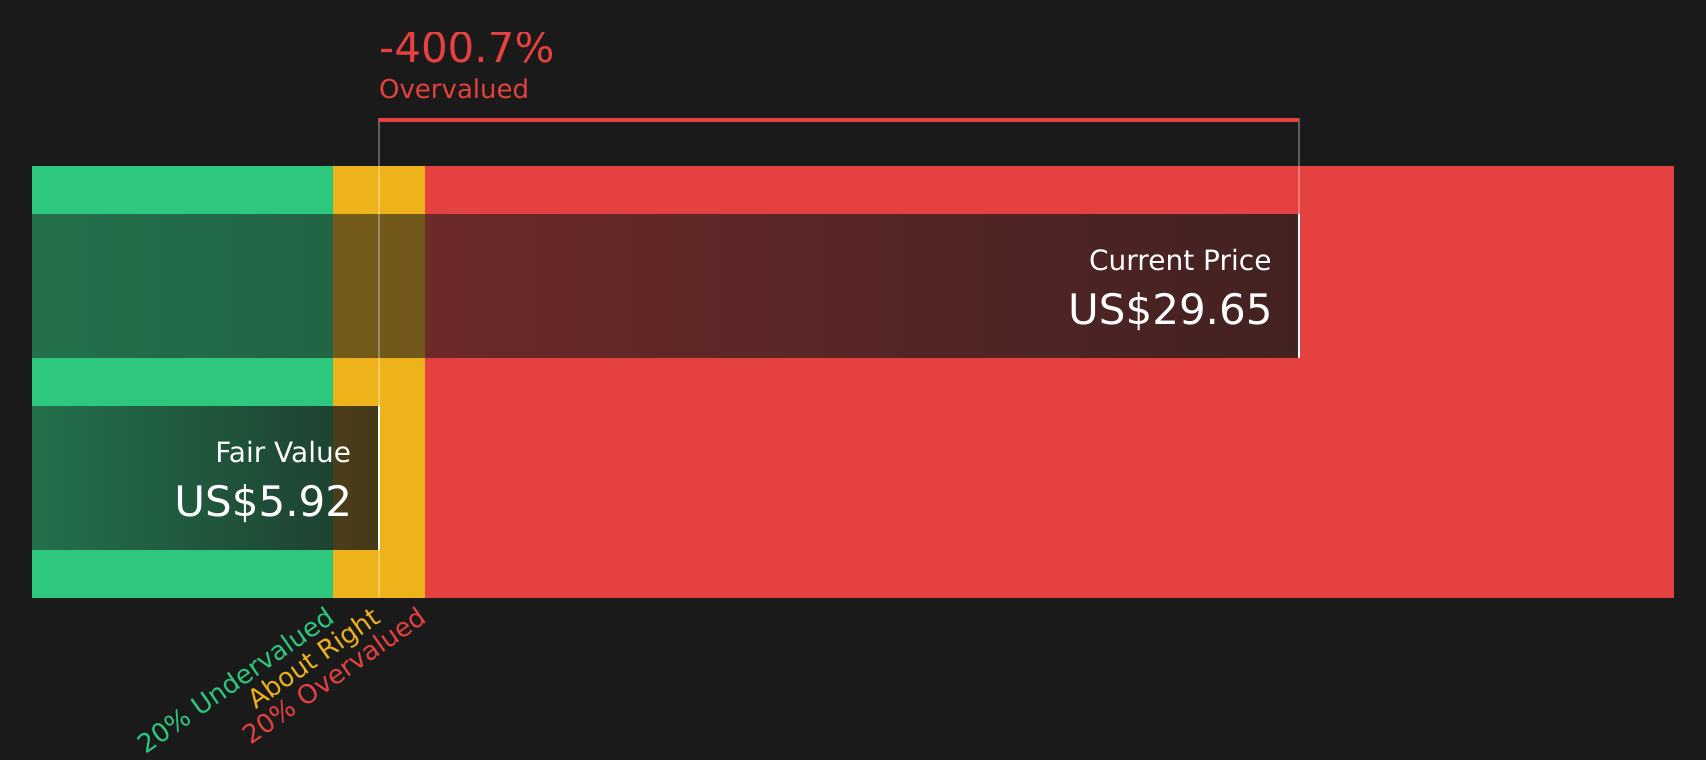
This cash flow stream results in an estimated intrinsic value of about $5.85 per share. Compared with the recent share price of around $29.27, the DCF output implies that the stock is roughly 400.5% above this modeled value, which points to a wide gap between the cash flow based estimate and where the market is currently pricing the shares.
Result: OVERVALUED
Our Discounted Cash Flow (DCF) analysis suggests Forestar Group may be overvalued by 400.5%. Discover 52 high quality undervalued stocks or create your own screener to find better value opportunities.
Approach 2: Forestar Group Price vs Earnings
For a profitable company like Forestar Group, the P/E ratio is a useful shorthand for how much investors are paying today for each dollar of current earnings. It ties the share price directly to the business’s ability to generate profit, which is often more stable than short term revenue or book value figures.
What counts as a “normal” P/E depends on how investors see growth potential and risk. Higher expected growth or lower perceived risk can support a higher P/E, while slower expected growth or higher risk usually points to a lower “fair” multiple.
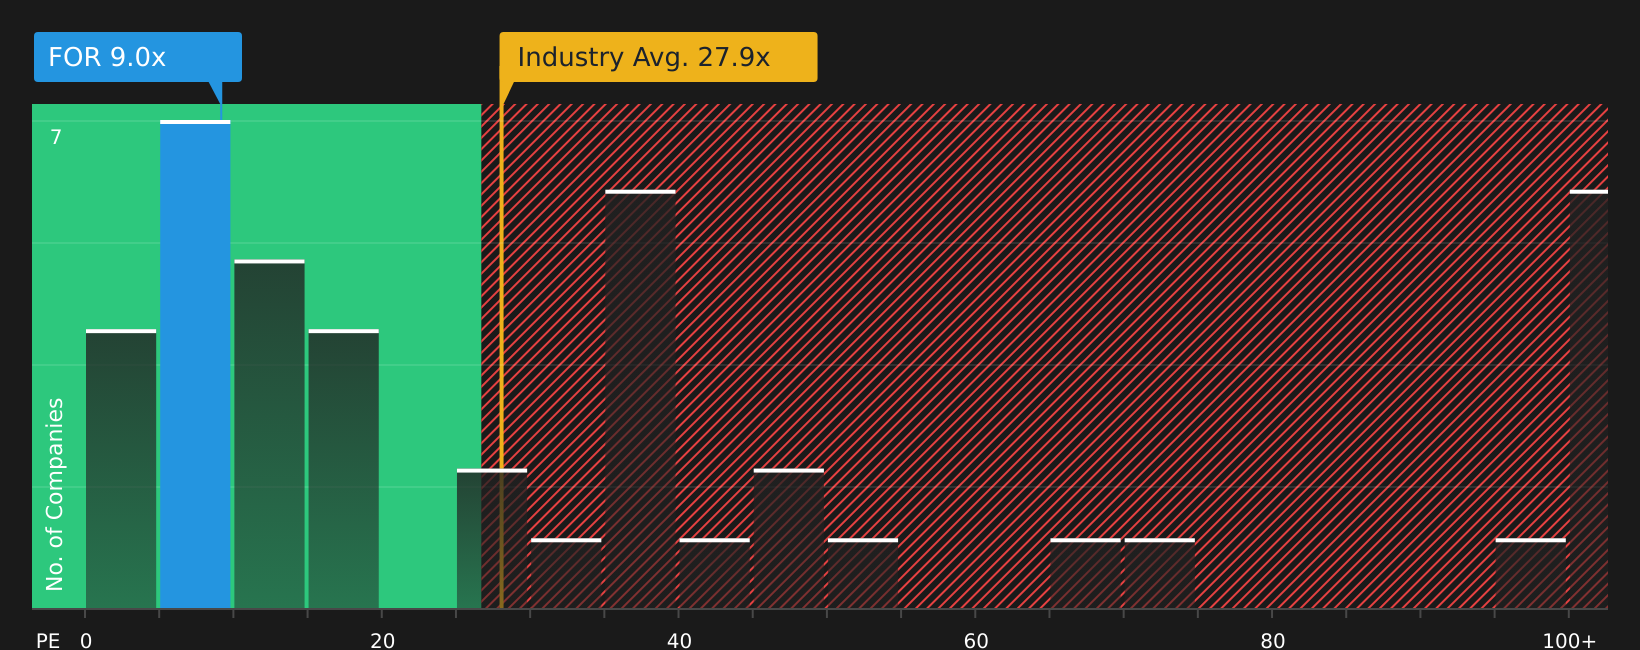
Forestar Group currently trades on a P/E of about 8.93x. That sits below both its Real Estate industry average P/E of 29.13x and a peer average of 11.15x. Simply Wall St’s Fair Ratio for Forestar Group is 15.89x. This is its view of a more tailored P/E based on factors like the company’s earnings growth profile, industry, profit margins, market cap and risk characteristics.
This Fair Ratio is more specific to Forestar Group than a simple peer or industry comparison because it adjusts for those company level traits rather than assuming all real estate names deserve the same multiple.
With a Fair Ratio of 15.89x versus the current 8.93x, the P/E view suggests Forestar Group shares are trading below that modeled level.
Result: UNDERVALUED
P/E ratios tell one story, but what if the real opportunity lies elsewhere? Start investing in legacies, not executives. Discover our 22 top founder-led companies.
Upgrade Your Decision Making: Choose your Forestar Group Narrative
Earlier we mentioned that there is an even better way to understand valuation, so let us introduce you to Narratives, which are simply your own story about a company linked directly to your numbers such as fair value, and your expectations for future revenue, earnings and margins.
On Simply Wall St, Narratives live on the Community page and are designed to be easy to use. You can set out how you see Forestar Group, connect that view to a financial forecast, and arrive at your own fair value instead of relying only on headline multiples.
Each Narrative then compares your Fair Value to the current Price to help you decide whether the stock looks attractive, fully priced or expensive according to your assumptions. It also updates automatically when new information like news or earnings is released so your view stays current without extra effort.
For example, one Forestar Group Narrative on the Community page might assume a relatively low fair value per share, while another assumes a much higher fair value per share. That gap reflects how two investors can look at the same data and still reach very different conclusions about what the stock is worth today.
Do you think there's more to the story for Forestar Group? Head over to our Community to see what others are saying!

This article by Simply Wall St is general in nature. We provide commentary based on historical data and analyst forecasts only using an unbiased methodology and our articles are not intended to be financial advice. It does not constitute a recommendation to buy or sell any stock, and does not take account of your objectives, or your financial situation. We aim to bring you long-term focused analysis driven by fundamental data. Note that our analysis may not factor in the latest price-sensitive company announcements or qualitative material. Simply Wall St has no position in any stocks mentioned.
Have feedback on this article? Concerned about the content? Get in touch with us directly. Alternatively, email editorial-team@simplywallst.com