

Is Matador Resources (MTDR) Offering Value After Recent Share Price Weakness?
- If you are wondering whether Matador Resources is offering good value right now, it helps to step back from the headline price and look at what the numbers actually say about the business.
- The share price last closed at US$47.35, with returns of 4.7% over the past 7 days, 12.1% over 30 days, 9.2% year to date, a 14.0% decline over 1 year, a 22.7% decline over 3 years, and a 154.7% gain over 5 years. Taken together, these figures give a mixed picture of recent momentum and risk sentiment.
- Recent news around Matador Resources has focused on the broader energy sector backdrop and how investors are reassessing companies with oil and gas exposure. This context helps explain why the stock has had both periods of strength and weakness, as markets react to changing views on commodity prices and sector risk.
- Right now Matador Resources has a valuation score of 5/6, which means it screens as undervalued on most of Simply Wall St's checks. Next, we will look at how different valuation methods arrive at that view and suggest an even more useful way to think about value at the end of the article.
Find out why Matador Resources's -14.0% return over the last year is lagging behind its peers.
Approach 1: Matador Resources Discounted Cash Flow (DCF) Analysis
A Discounted Cash Flow, or DCF, model takes estimates of the cash Matador Resources could generate in the future and discounts those back to what they might be worth in today's dollars. It is essentially asking what you would pay now for the stream of future Free Cash Flows.
Matador Resources currently has trailing twelve month Free Cash Flow of about $433.2 million. Using a 2 Stage Free Cash Flow to Equity model based on cash flow projections, analysts and model estimates point to Free Cash Flow of $853.7 million in 2030, with interim years such as 2026 to 2029 ranging between roughly $616.3 million and $823.9 million before discounting. Simply Wall St only has explicit analyst inputs for up to five years, so later years are extrapolated within the model.
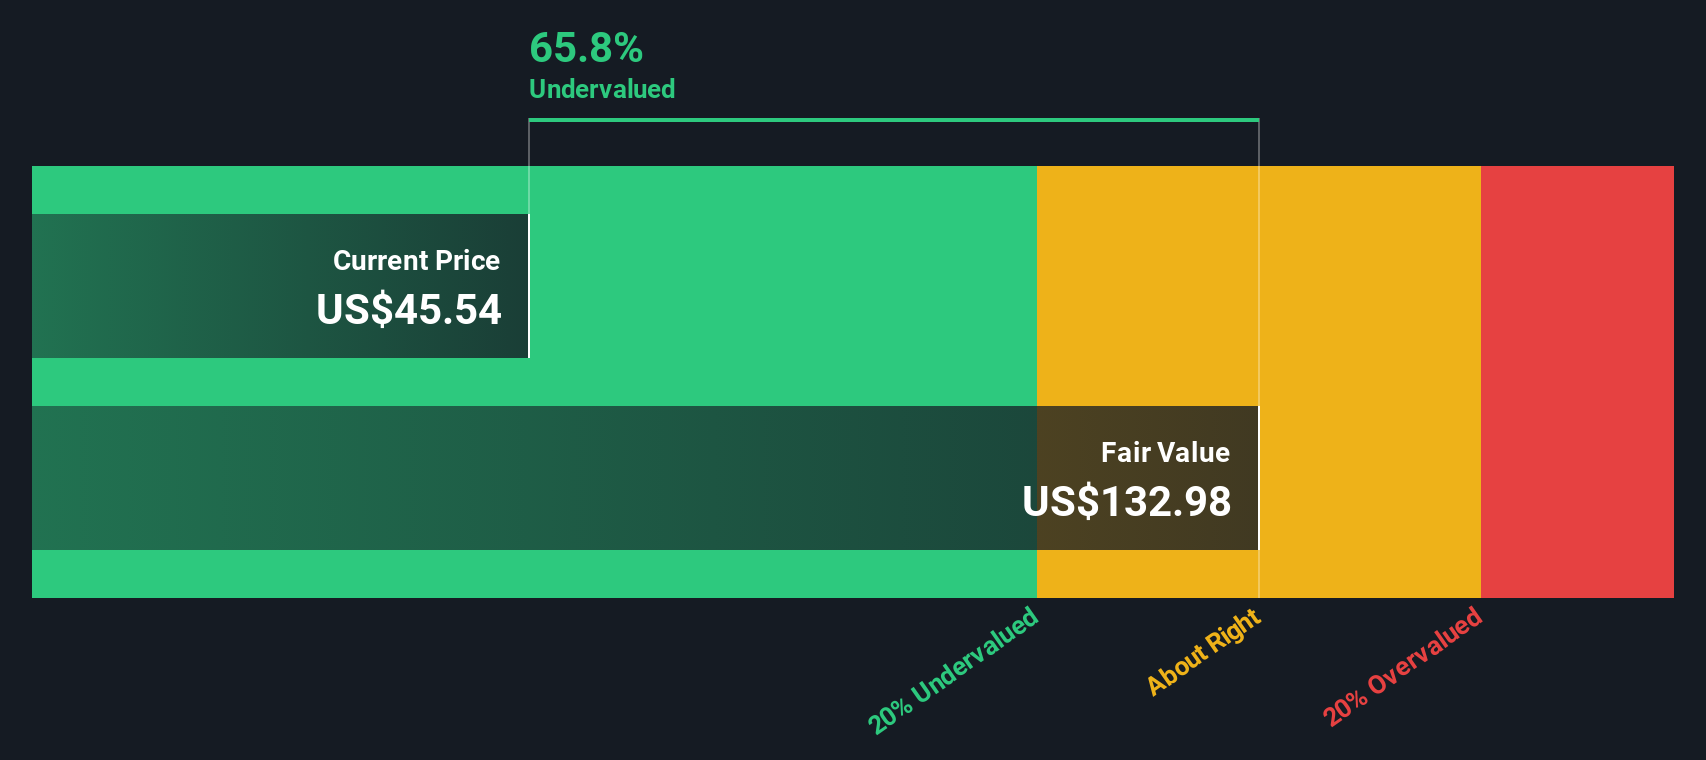
When all those projected cash flows are discounted back to today, the model arrives at an estimated intrinsic value of about $153.30 per share. Compared with the recent share price of US$47.35, this implies an intrinsic discount of roughly 69.1%, which suggests the shares currently screen as materially undervalued on this DCF view.
Result: UNDERVALUED
Our Discounted Cash Flow (DCF) analysis suggests Matador Resources is undervalued by 69.1%. Track this in your watchlist or portfolio, or discover 52 more high quality undervalued stocks.
Approach 2: Matador Resources Price vs Earnings
For a profitable company like Matador Resources, the P/E ratio is a useful shorthand for how much investors are paying for each dollar of earnings. It connects directly to what the business is currently earning, which many investors find easier to relate to than a complex cash flow model.
What counts as a “normal” P/E depends a lot on growth expectations and risk. Higher expected growth or lower perceived risk can support a higher multiple, while slower growth or higher risk typically means a lower, more conservative P/E.
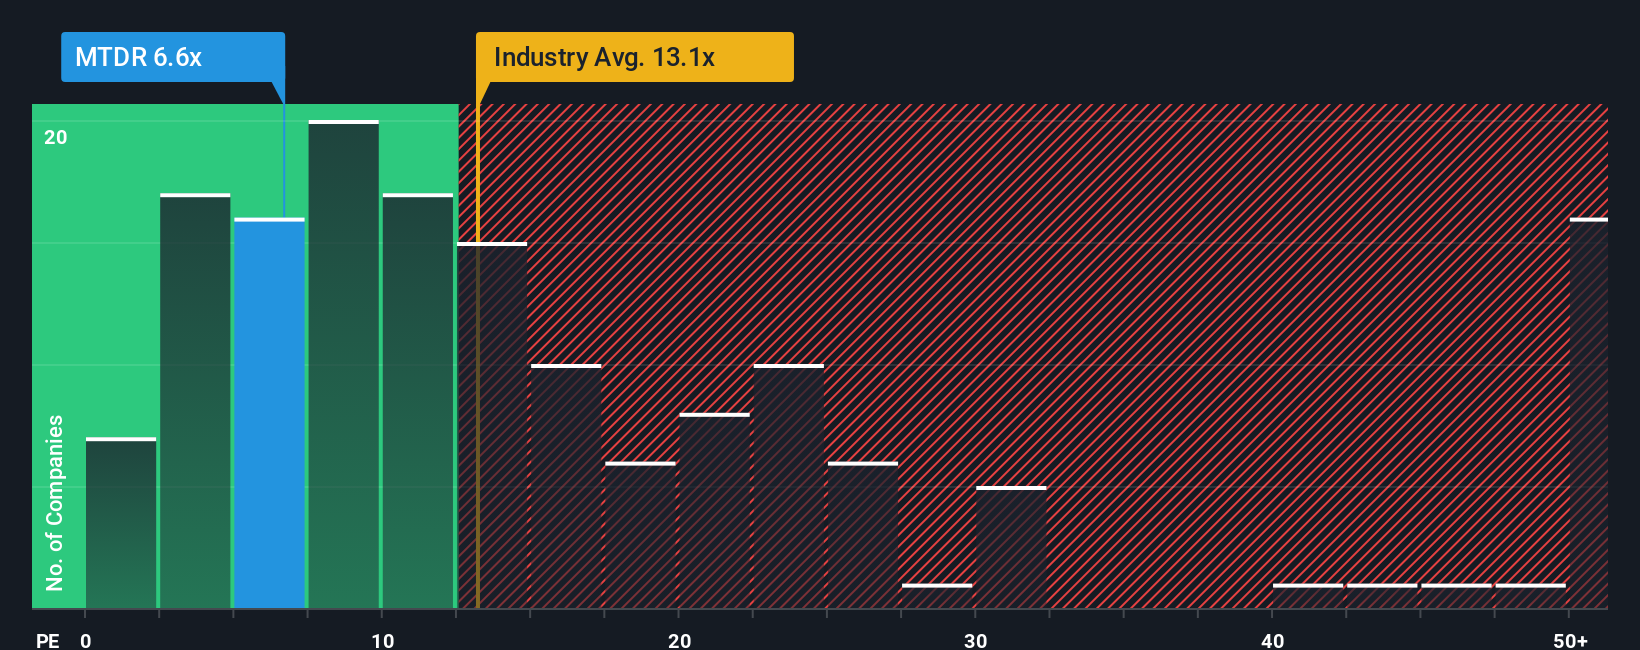
Matador Resources is trading on a P/E of 7.53x. That sits below both the Oil and Gas industry average of 14.13x and the broader peer group average of 26.55x, so the stock currently trades at a lower earnings multiple than many comparable companies.
Simply Wall St’s Fair Ratio for Matador Resources is 17.08x. This is a proprietary estimate of what the P/E might be, given factors such as earnings growth, industry, profit margin, market cap and specific risks. It can be more informative than a simple comparison with peers or the industry because it adjusts for the company’s own profile rather than assuming all businesses deserve the same multiple.
Since the current P/E of 7.53x is below the Fair Ratio of 17.08x, the stock screens as undervalued on this earnings based view.
Result: UNDERVALUED
P/E ratios tell one story, but what if the real opportunity lies elsewhere? Start investing in legacies, not executives. Discover our 22 top founder-led companies.
Upgrade Your Decision Making: Choose your Matador Resources Narrative
Earlier we mentioned that there is an even better way to understand valuation, so let us introduce you to Narratives, which Simply Wall St hosts on the Community page used by millions of investors.
A Narrative is your story about a company that you connect directly to the numbers, such as what you think Matador Resources could earn in the future, what margins it might achieve and what that means for a fair value per share.
In practical terms, a Narrative links three things: the business story, a financial forecast and a resulting fair value that you can then compare with the current share price to help you decide if the stock looks expensive or cheap on your view.
The useful part is that Narratives on Simply Wall St update automatically when new information appears, such as fresh earnings or major news, so your forecast and fair value move with the story rather than sitting in an old spreadsheet.
For example, one Matador Resources Narrative might assume a very cautious outlook and reach a low fair value, while another might assume stronger revenue and margin potential and reach a much higher fair value, giving you a clear sense of how different opinions translate into different prices.
Do you think there's more to the story for Matador Resources? Head over to our Community to see what others are saying!

This article by Simply Wall St is general in nature. We provide commentary based on historical data and analyst forecasts only using an unbiased methodology and our articles are not intended to be financial advice. It does not constitute a recommendation to buy or sell any stock, and does not take account of your objectives, or your financial situation. We aim to bring you long-term focused analysis driven by fundamental data. Note that our analysis may not factor in the latest price-sensitive company announcements or qualitative material. Simply Wall St has no position in any stocks mentioned.
Have feedback on this article? Concerned about the content? Get in touch with us directly. Alternatively, email editorial-team@simplywallst.com