

Ubiquiti (UI) Valuation Check After Record Q2 Results And Dividend Declaration
Ubiquiti (UI) drew investor focus after reporting record fiscal second quarter results, with sales of US$814.87 million, higher net income and earnings per share, along with a declared US$0.80 per share cash dividend.
See our latest analysis for Ubiquiti.
The strong fiscal second quarter update and dividend declaration have coincided with a sharp re-rating in the stock, with an 8.04% 1 day share price return, 14.22% 7 day share price return and 9.90% year to date share price return. At the same time, the 70.58% 1 year total shareholder return and 127.80% 3 year total shareholder return suggest momentum has been building despite the backdrop of legal and compliance headlines.
If Ubiquiti’s move has caught your attention, it could be a good moment to broaden your search with our screener of 33 AI infrastructure stocks as potential next ideas to review.
With the shares now near the US$623 analyst price target and trading after a strong run, the key question is whether Ubiquiti still looks undervalued on its fundamentals, or if the market is already pricing in future growth.
Price-to-Earnings of 42.4x: Is it justified?
On a P/E of 42.4x, Ubiquiti is priced above both its peers and its own estimated fair P/E level, which stands out at a $622.33 share price.
The P/E multiple compares the current share price with earnings per share. It is a quick way to see how much investors are paying for each dollar of profit. For Ubiquiti, this higher multiple sits alongside strong recent earnings growth of 99.7% over the past year, 5.8% per year over five years, and an 87.5% return on equity.
Compared with the US Communications industry average P/E of 32.8x, Ubiquiti’s 42.4x multiple is materially higher. It is also above the estimated fair P/E of 35.8x that our fair ratio work suggests the market could gravitate toward over time.
Explore the SWS fair ratio for Ubiquiti
Result: Price-to-Earnings of 42.4x (OVERVALUED)
However, legal and compliance issues, along with the current 42.4x P/E sitting above peers and fair value estimates, could limit the potential upside if sentiment or expectations shift.
Find out about the key risks to this Ubiquiti narrative.
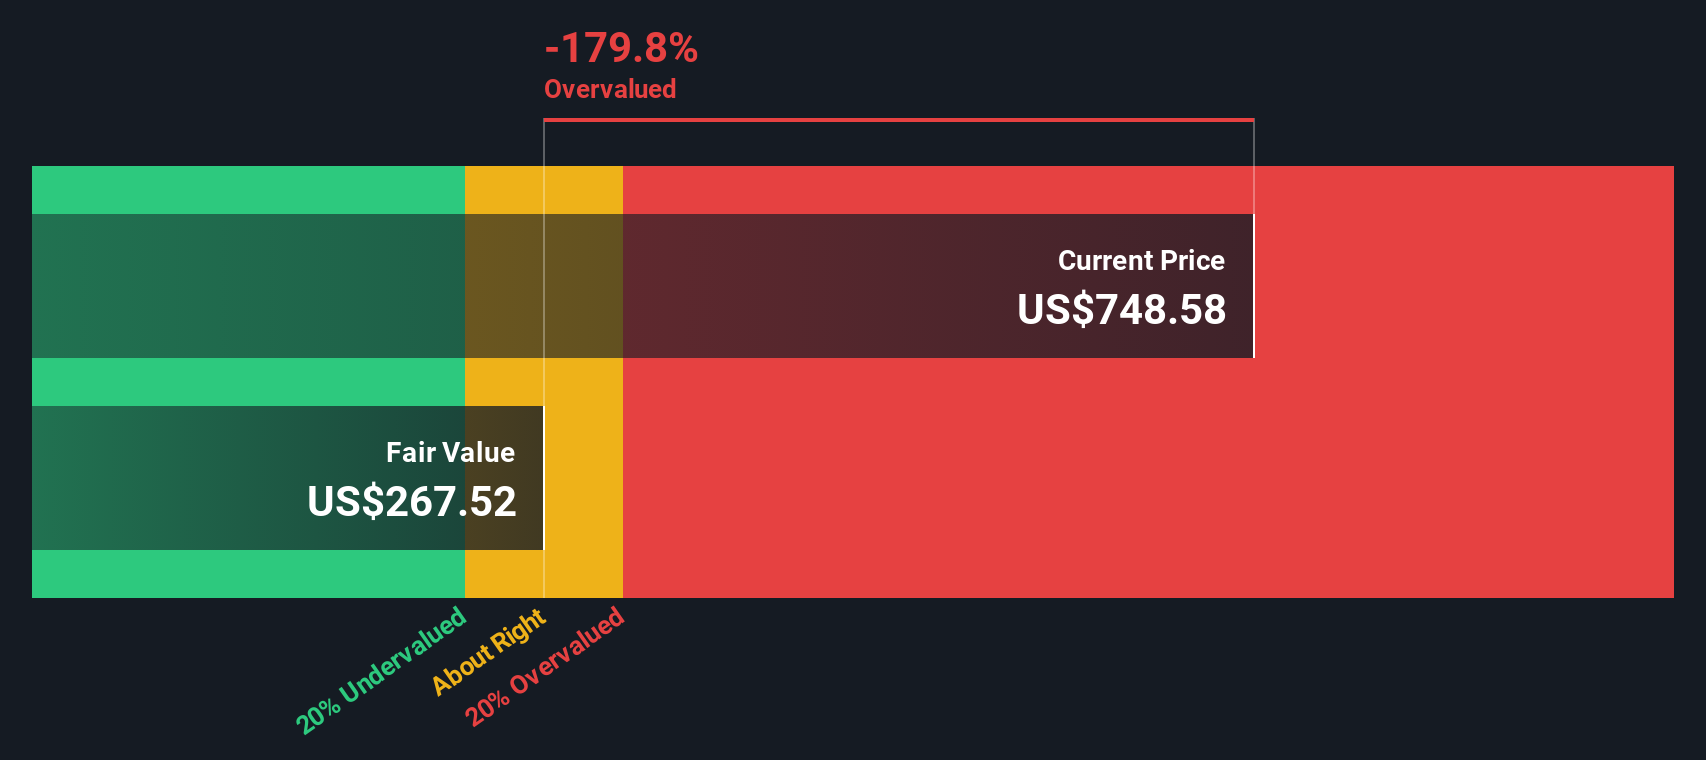
Another View: Cash Flows Paint a Harsher Picture
While the 42.4x P/E suggests Ubiquiti is expensive, our DCF model is even tougher, with an estimated future cash flow value of $198.72 per share versus the current $622.33. If both methods point to rich pricing, what might be keeping buyers so confident?
Look into how the SWS DCF model arrives at its fair value.
Simply Wall St performs a discounted cash flow (DCF) on every stock in the world every day (check out Ubiquiti for example). We show the entire calculation in full. You can track the result in your watchlist or portfolio and be alerted when this changes, or use our stock screener to discover 52 high quality undervalued stocks. If you save a screener we even alert you when new companies match - so you never miss a potential opportunity.
Build Your Own Ubiquiti Narrative
If you see the numbers differently or want to stress test your own assumptions against the data, you can build and refine a custom view of Ubiquiti in just a few minutes, starting with Do it your way.
A great starting point for your Ubiquiti research is our analysis highlighting 2 key rewards and 1 important warning sign that could impact your investment decision.
Looking for more investment ideas?
If Ubiquiti is already on your radar, do not stop there. You can quickly compare other opportunities and see which ones truly earn a spot on your watchlist.
- Target value-focused opportunities by scanning our list of 52 high quality undervalued stocks that pair solid fundamentals with prices that may not fully reflect them yet.
- Prioritise resilience by filtering for 84 resilient stocks with low risk scores that score well on stability and may help balance out more volatile positions.
- Spot potential up-and-comers early through our screener containing 24 high quality undiscovered gems that many investors might not be watching closely yet.
This article by Simply Wall St is general in nature. We provide commentary based on historical data and analyst forecasts only using an unbiased methodology and our articles are not intended to be financial advice. It does not constitute a recommendation to buy or sell any stock, and does not take account of your objectives, or your financial situation. We aim to bring you long-term focused analysis driven by fundamental data. Note that our analysis may not factor in the latest price-sensitive company announcements or qualitative material. Simply Wall St has no position in any stocks mentioned.
Have feedback on this article? Concerned about the content? Get in touch with us directly. Alternatively, email editorial-team@simplywallst.com