

Is Voyager Technologies (VOYG) Now At An Interesting Price After Recent Share Weakness
- If you are wondering whether Voyager Technologies is starting to look like good value or just fairly priced at today’s levels, you are in the right place.
- The share price closed at US$29.05, with a flat 7 day return, a 7.3% decline over the last 30 days, and a 4.6% gain year to date. This may signal shifting views on both opportunity and risk.
- Recent attention on Voyager Technologies has centered on its position within the capital goods sector and how its current share price lines up with fundamentals. This has prompted more investors to ask whether the current valuation still reflects the company’s underlying business profile and prospects.
- On our 6 point valuation checklist, Voyager Technologies currently scores a 3 out of 6, suggesting some areas of potential undervaluation to unpack. We will walk through those methods next before closing with a way to assess value that goes beyond the usual ratios.
Approach 1: Voyager Technologies Discounted Cash Flow (DCF) Analysis
A Discounted Cash Flow model takes projected future cash flows, then discounts them back to today using a required rate of return to estimate what the business might be worth right now.
For Voyager Technologies, the latest twelve month Free Cash Flow is a loss of about $51.5 million. The model then uses analyst forecasts and further projections to map out cash flows over the next decade. These range from a projected loss of $342.7 million in 2026 to a projected Free Cash Flow of $1.9 billion in 2035, all expressed in $ and discounted back to today under a 2 Stage Free Cash Flow to Equity approach.
Pulling those discounted projections together gives an estimated intrinsic value of about $443.50 per share. Compared with the recent share price of US$29.05, the DCF output implies Voyager Technologies trades at a 93.4% discount to this intrinsic estimate, which points to a wide potential valuation gap.
Result: UNDERVALUED
Our Discounted Cash Flow (DCF) analysis suggests Voyager Technologies is undervalued by 93.4%. Track this in your watchlist or portfolio, or discover 52 more high quality undervalued stocks.
Approach 2: Voyager Technologies Price vs Sales
For companies where earnings are limited or volatile, the P/S ratio is often a more practical yardstick because it focuses on revenues rather than profits, which can swing with accounting charges or investment spend.
What investors are really weighing is how growth expectations and risk should influence a normal or fair P/S multiple. Higher expected growth and lower perceived risk can justify a higher P/S, while slower growth and higher risk usually call for a lower one.
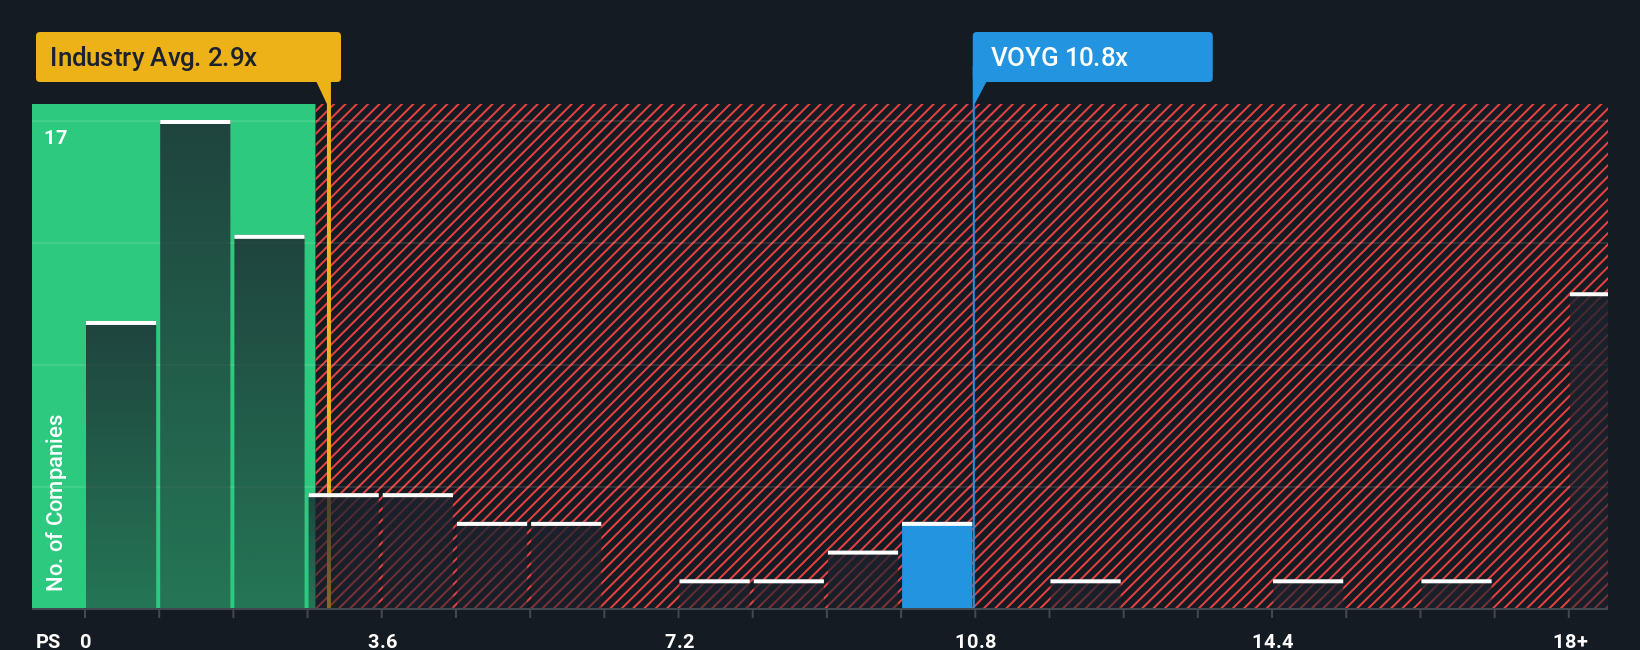
Voyager Technologies currently trades on a P/S of 10.98x. That sits above the Aerospace & Defense industry average of 4.00x and the peer group average of 2.80x, which on a simple comparison can make the stock look expensive.
Simply Wall St’s Fair Ratio for Voyager Technologies is 5.73x. This proprietary figure aims to capture what a reasonable P/S might be, given factors such as earnings growth, profit margins, industry, market cap and specific risks. Because it blends these elements instead of relying only on broad peer or industry averages, it can give a more tailored view of value.
Set against the current 10.98x P/S, the 5.73x Fair Ratio points to Voyager Technologies trading above this tailored estimate.
Result: OVERVALUED
P/S ratios tell one story, but what if the real opportunity lies elsewhere? Start investing in legacies, not executives. Discover our 22 top founder-led companies.
Upgrade Your Decision Making: Choose your Voyager Technologies Narrative
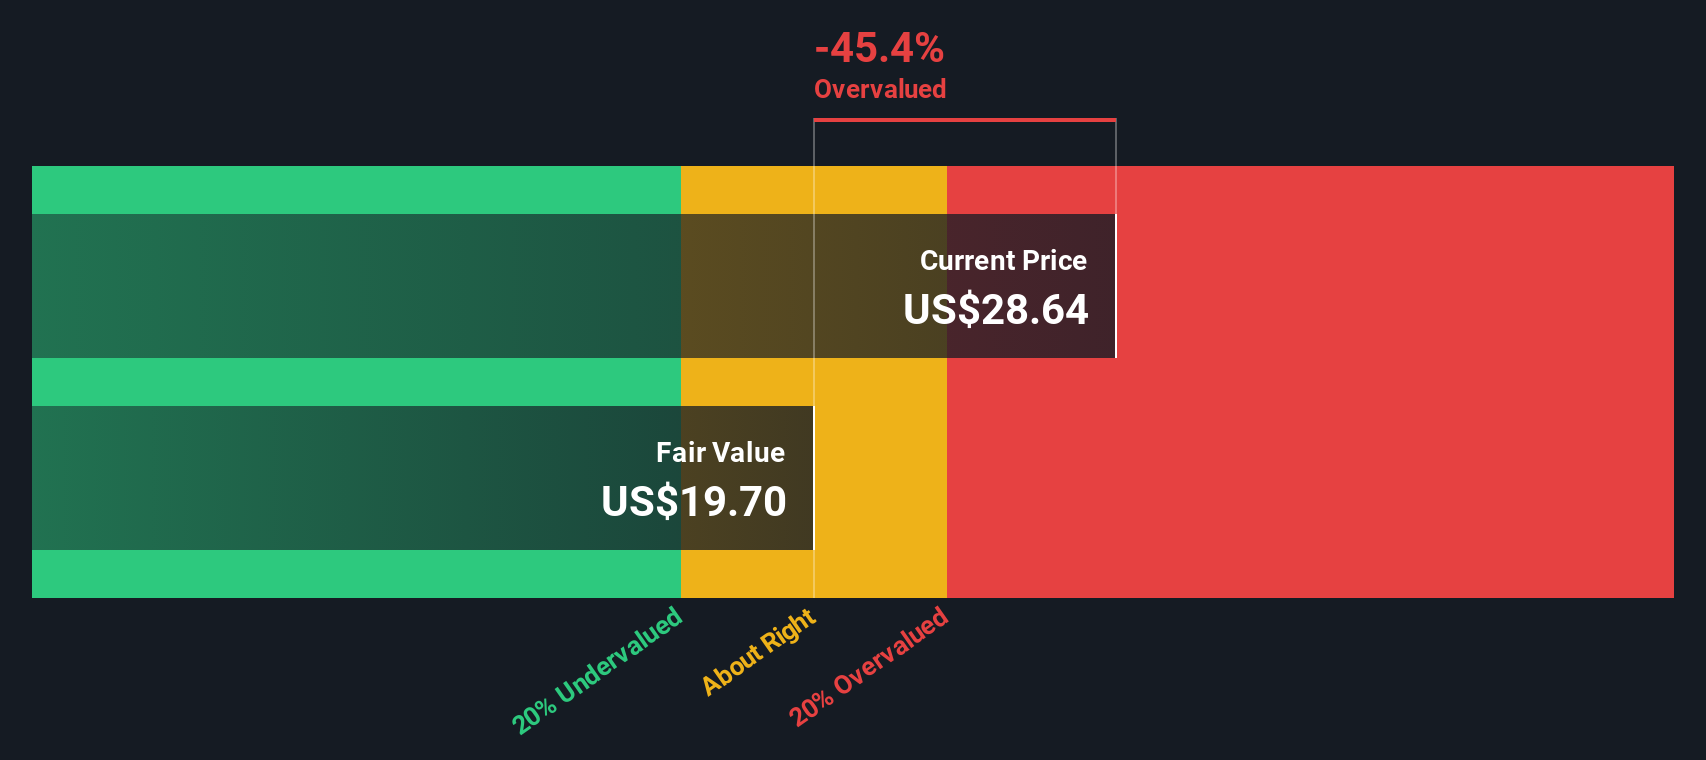
Earlier we mentioned that there is an even better way to think about value. On Simply Wall St this comes through Narratives, which let you attach a clear story about Voyager Technologies to your own revenue, earnings and margin estimates. You can then link that story to a financial forecast and Fair Value on the Community page used by millions of investors. Next, you can compare that Fair Value with the current share price to help you decide whether to buy, hold or sell, with your view updating automatically when fresh news or earnings arrive. For Voyager, you might lean toward a higher Fair Value of about US$45 if you agree with the more optimistic assumptions, or closer to US$26 if you share the more cautious view. Narratives give you a simple way to see which of those feels closer to your own expectations.
For Voyager Technologies however we will make it really easy for you with previews of two leading Voyager Technologies Narratives:
🐂 Voyager Technologies Bull Case
Fair value: US$45.00
Implied discount to this fair value: about 35.5% compared with the recent US$29.05 share price
Revenue growth assumption: 75.4% per year
- Assumes Voyager converts its position across missile defense, low cost launch and LEO constellations, and commercial space stations into strong revenue growth and improving margins over time.
- Highlights Starlab and a series of acquisitions in propulsion, sensing and communications as building blocks for higher margin, recurring revenue, all supported by a sizeable cash balance and no debt.
- Suggests the bullish US$45.00 analyst target is supported if revenues reach about US$849.8m and earnings reach about US$71.4m by 2029, with the market willing to pay a P/E of 57.2x on those earnings.
🐻 Voyager Technologies Bear Case
Fair value: US$26.05
Implied premium to this fair value: about 11.5% compared with the recent US$29.05 share price
Revenue growth assumption: 40.3% per year
- Assumes program timing, budget risk and competition across missile defense and satellite subsystems keep a lid on revenue growth, pricing power and margin expansion.
- Flags execution and integration risk around Starlab and recent acquisitions, where delays or weaker than expected synergies could hold back EBITDA and earnings.
- Suggests the bearish US$26.05 analyst target is supported if revenues reach about US$435.1m and earnings reach about US$36.6m by 2028, with the market paying a higher 64.5x P/E to reflect risk.
Putting these side by side, you can see how different views on contract timing, Starlab, acquisitions and future margins lead to very different fair values. If you want to see how other investors are weighing those trade offs and how the full narratives read from top to bottom, Curious how numbers become stories that shape markets? Explore Community Narratives.
Do you think there's more to the story for Voyager Technologies? Head over to our Community to see what others are saying!

This article by Simply Wall St is general in nature. We provide commentary based on historical data and analyst forecasts only using an unbiased methodology and our articles are not intended to be financial advice. It does not constitute a recommendation to buy or sell any stock, and does not take account of your objectives, or your financial situation. We aim to bring you long-term focused analysis driven by fundamental data. Note that our analysis may not factor in the latest price-sensitive company announcements or qualitative material. Simply Wall St has no position in any stocks mentioned.
Have feedback on this article? Concerned about the content? Get in touch with us directly. Alternatively, email editorial-team@simplywallst.com