

Is ACI Worldwide (ACIW) Pricing Reflect Its DCF Value After Recent Share Price Pullback
- If you are wondering whether ACI Worldwide at around US$41.83 is priced fairly or offering a bargain, you are not alone. This article focuses squarely on what you are getting for the price you pay.
- The share price has moved 5.8% over the last 7 days, while returns sit at a 10.6% decline over 30 days, an 8.4% decline year to date and a 20.0% decline over 1 year, set against a 55.9% gain over 3 years and a 1.2% gain over 5 years.
- Recent news around ACI Worldwide has mainly centered on its role in digital payments and ongoing interest in how established payment software providers are positioned as transaction volumes and payment channels evolve. Together with the mixed return profile, this context has kept attention on whether the current share price aligns with the company’s underlying fundamentals.
- On our checklist of valuation tests, ACI Worldwide currently records a valuation score of 6 out of 6. Next we will walk through the standard valuation methods behind that score, before finishing with a way to think about value that goes beyond any single model.
Find out why ACI Worldwide's -20.0% return over the last year is lagging behind its peers.
Approach 1: ACI Worldwide Discounted Cash Flow (DCF) Analysis
A Discounted Cash Flow, or DCF, model estimates what a company might be worth by projecting its future cash flows and discounting them back to today’s value. It is essentially asking what tomorrow’s cash is worth in your pocket right now.
For ACI Worldwide, the model uses a 2 Stage Free Cash Flow to Equity approach based on cash flow projections. The latest twelve month Free Cash Flow is about $283.1 million. Analyst inputs and extrapolated estimates extend out ten years, with projected Free Cash Flow of $513.2 million in 2035. These figures are all in $ and represent cash potentially available to equity holders after necessary spending.
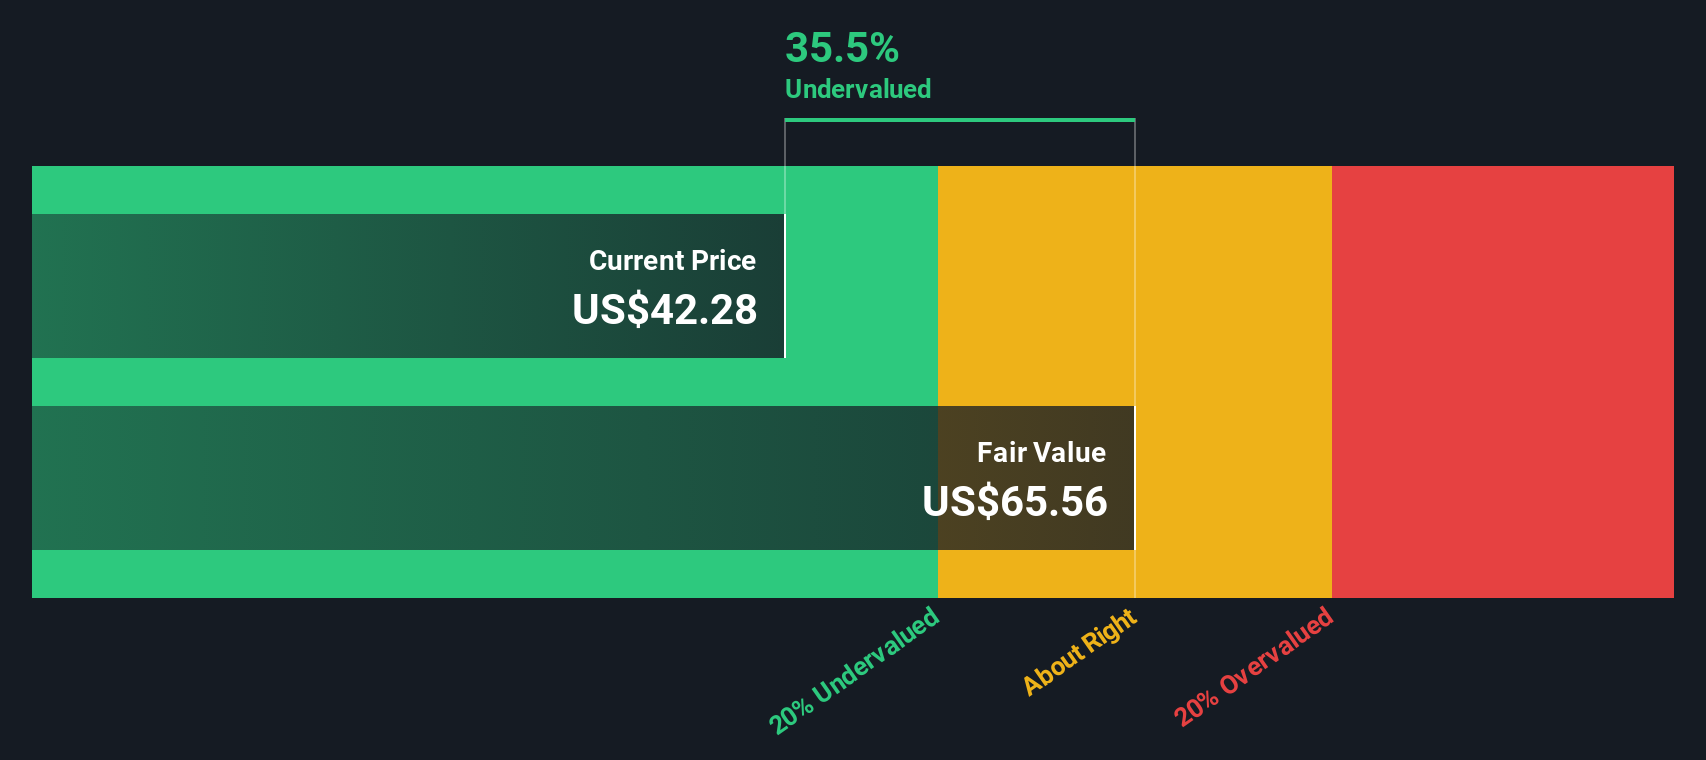
Combining these projected cash flows, the DCF model arrives at an estimated intrinsic value of $65.12 per share, compared with a recent share price of about $41.83. On this basis, the stock screens as roughly 35.8% undervalued relative to the model’s estimate.
Result: UNDERVALUED
Our Discounted Cash Flow (DCF) analysis suggests ACI Worldwide is undervalued by 35.8%. Track this in your watchlist or portfolio, or discover 52 more high quality undervalued stocks.
Approach 2: ACI Worldwide Price vs Earnings
For profitable companies, the P/E ratio is a useful way to think about what you are paying for each dollar of current earnings. A higher P/E usually reflects higher growth expectations or a perception of lower risk, while a lower P/E can signal more modest expectations or higher perceived risk.
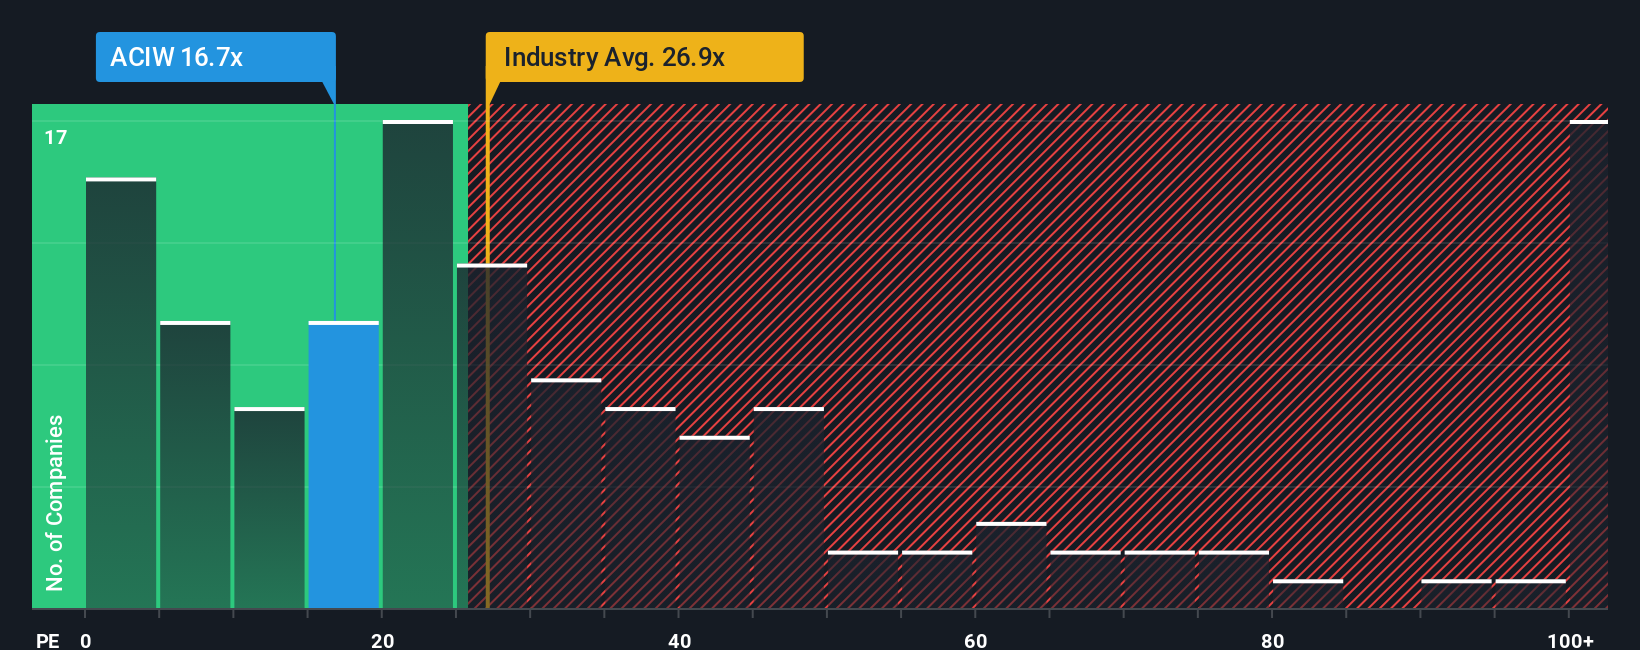
ACI Worldwide currently trades on a P/E of 16.53x. This sits below the Software industry average P/E of 27.99x and the peer group average of 40.60x, so the market is assigning a lower earnings multiple to ACI Worldwide than to many of its listed software peers.
Simply Wall St’s Fair Ratio for ACI Worldwide is 23.06x. This is a proprietary estimate of what an appropriate P/E could be, based on factors such as the company’s earnings growth profile, industry, profit margins, market cap and specific risks. Because it blends these company specific inputs, the Fair Ratio can give a more tailored reference point than a simple comparison with peers or a broad industry average.
Comparing the Fair Ratio of 23.06x with the current P/E of 16.53x suggests the shares are trading below that model based reference point.
Result: UNDERVALUED
P/E ratios tell one story, but what if the real opportunity lies elsewhere? Start investing in legacies, not executives. Discover our 22 top founder-led companies.
Upgrade Your Decision Making: Choose your ACI Worldwide Narrative
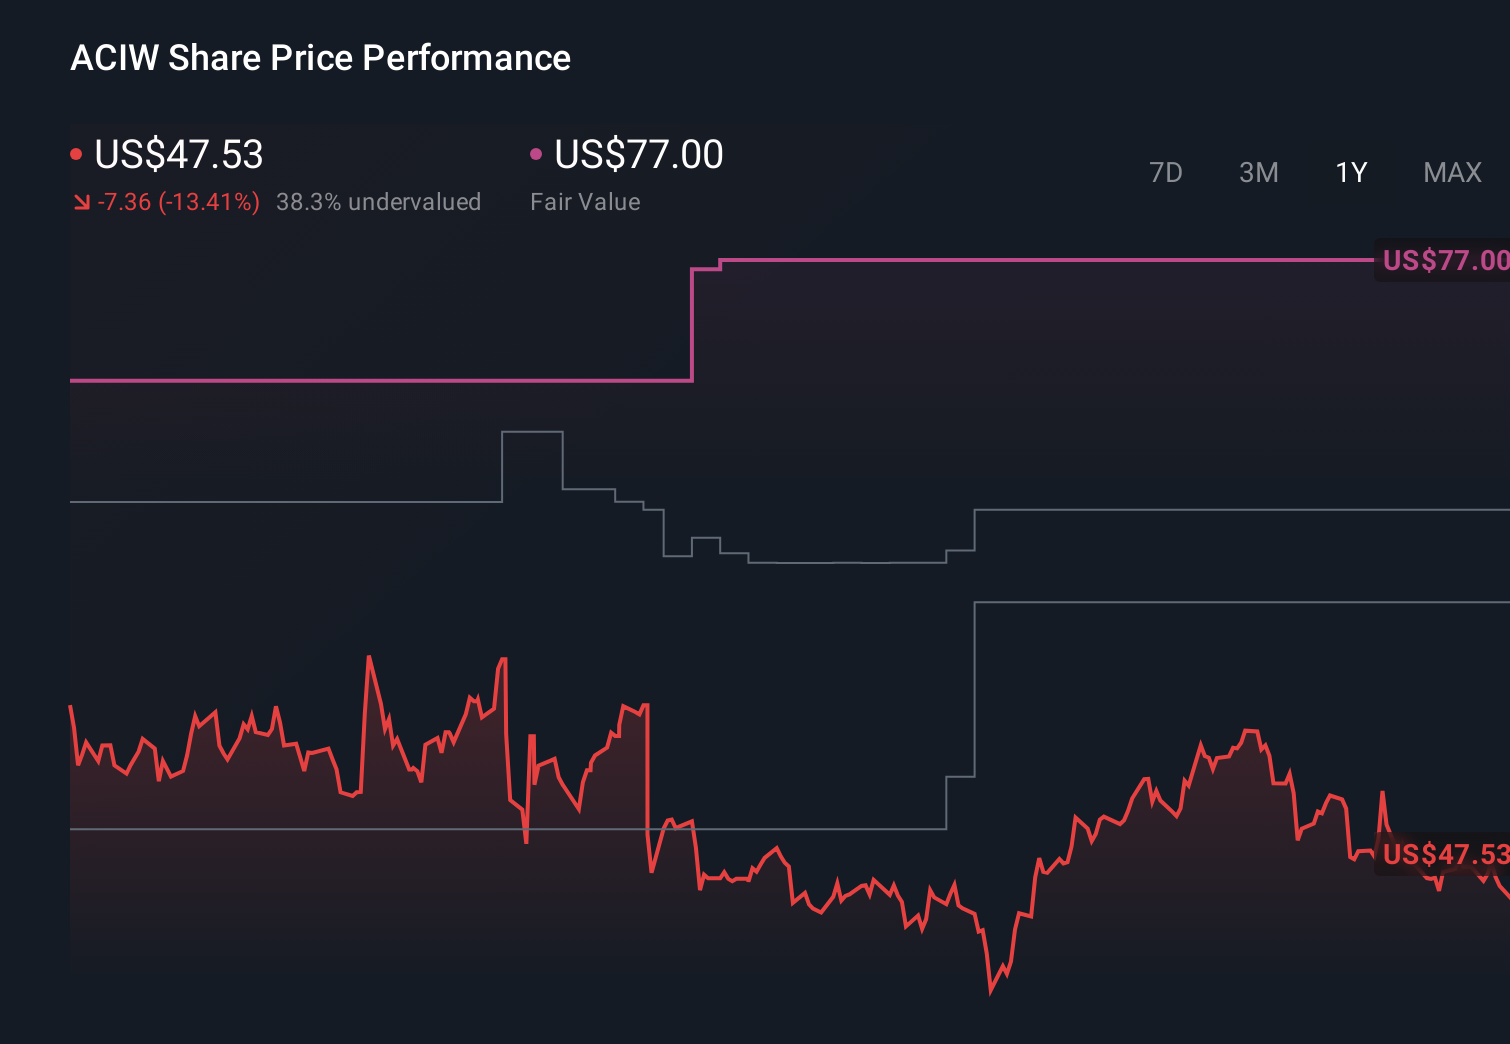
Earlier we mentioned that there is an even better way to understand valuation. On Simply Wall St’s Community page you can use Narratives to attach your own story to ACI Worldwide’s numbers. You can link your view of its future revenue, earnings and margins to a forecast and a Fair Value that you can compare with the current price to help inform your decision. These figures update as new news or earnings arrive. For example, one Narrative might lean toward the higher Fair Value of US$77.00 based on confidence in areas like cloud native payments and real time fraud solutions. Another might sit closer to the lower Fair Value of US$48.73 because it puts more weight on risks around legacy systems, competition and customer concentration.
Do you think there's more to the story for ACI Worldwide? Head over to our Community to see what others are saying!
This article by Simply Wall St is general in nature. We provide commentary based on historical data and analyst forecasts only using an unbiased methodology and our articles are not intended to be financial advice. It does not constitute a recommendation to buy or sell any stock, and does not take account of your objectives, or your financial situation. We aim to bring you long-term focused analysis driven by fundamental data. Note that our analysis may not factor in the latest price-sensitive company announcements or qualitative material. Simply Wall St has no position in any stocks mentioned.
Have feedback on this article? Concerned about the content? Get in touch with us directly. Alternatively, email editorial-team@simplywallst.com