

Is It Time To Revisit SEI Investments (SEIC) After Recent Share Price Weakness?
- If you are wondering whether SEI Investments is priced fairly or if there is still value on the table, this article walks through what the current share price might be implying.
- The stock last closed at US$82.30, with returns of 37.0% over 3 years and 51.7% over 5 years. The shorter term picture shows a 2.2% decline over the past week, a 5.2% decline over the past month, and a 0.9% decline year to date, with a 0.7% return over the past year.
- Recent news coverage around SEI Investments has focused on its role as a diversified financial services company and how it is positioned in the broader asset management and investment technology space. This context helps explain why sentiment can shift between periods of optimism about its long term positioning and caution when short term conditions change.
- On our checks, SEI Investments has a valuation score of 5/6. This sets up a closer look at how methods like DCF and multiples compare, and hints at an even clearer way to think about valuation that we will come back to at the end of the article.
Find out why SEI Investments's 0.7% return over the last year is lagging behind its peers.
Approach 1: SEI Investments Excess Returns Analysis
The Excess Returns model looks at how much profit a company is expected to earn above the return that shareholders require, based on the equity cost, and then values the shares by capitalising those excess profits.
For SEI Investments, the model starts with a Book Value of $20.03 per share and a Stable EPS estimate of $6.94 per share, based on weighted future Return on Equity estimates from 4 analysts. The implied Cost of Equity is $1.75 per share, which leaves an Excess Return of $5.19 per share. That excess is supported by an Average Return on Equity of 31.11%, alongside a Stable Book Value estimate of $22.30 per share, based on future Book Value estimates from 2 analysts.
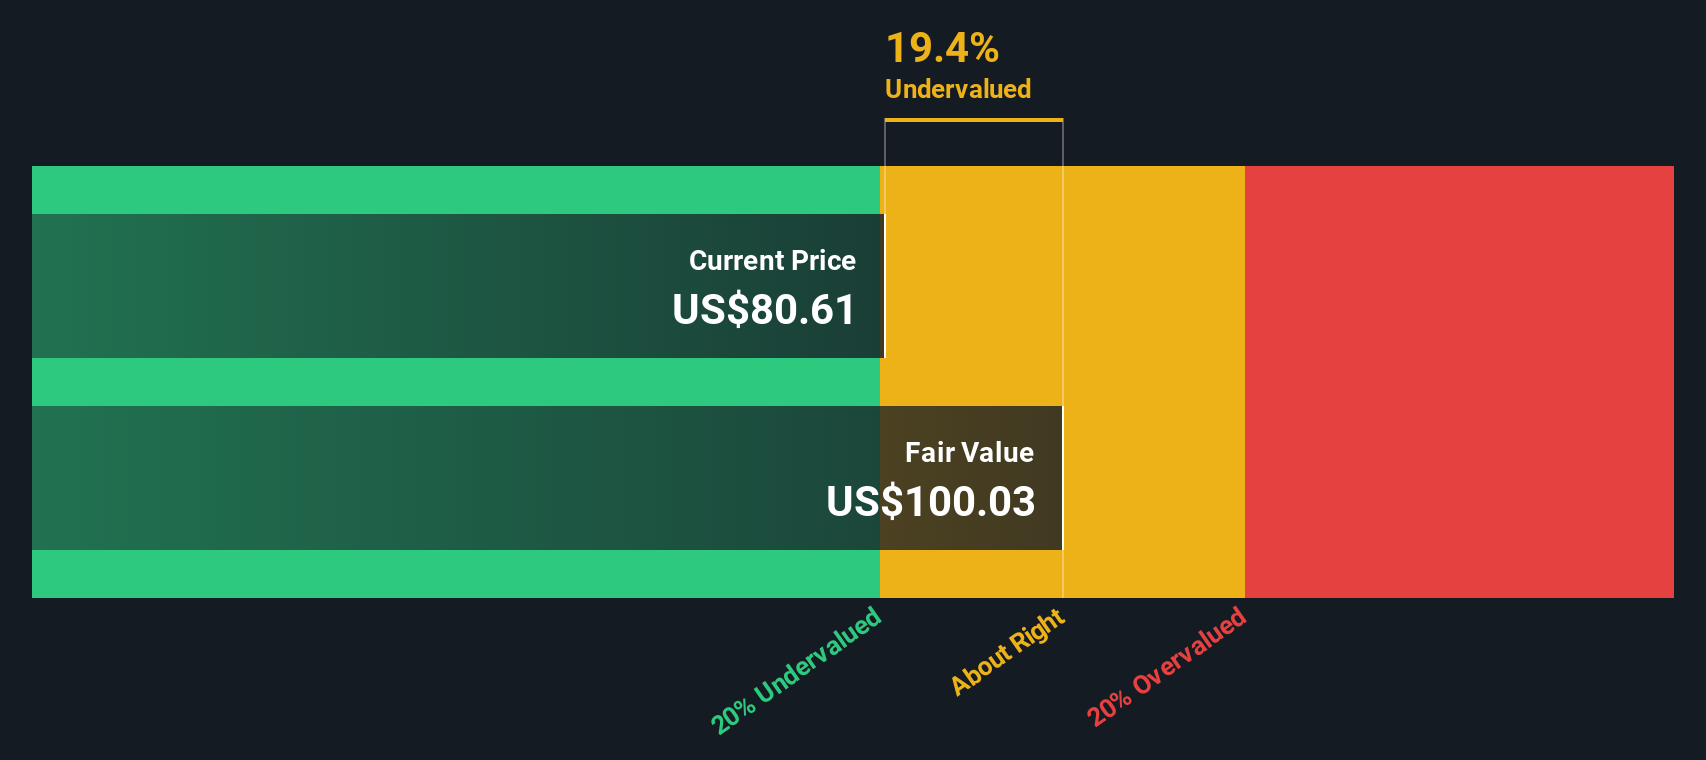
Using these inputs, the Excess Returns model arrives at an intrinsic value of about $139.27 per share, compared with the recent share price of $82.30. That gap corresponds to an implied discount of 40.9%, which indicates that the shares are trading below this model’s estimate of value.
Result: UNDERVALUED
Our Excess Returns analysis suggests SEI Investments is undervalued by 40.9%. Track this in your watchlist or portfolio, or discover 51 more high quality undervalued stocks.
Approach 2: SEI Investments Price vs Earnings
For a consistently profitable company, the P/E ratio is a useful anchor because it links what you pay directly to the earnings the business is already generating. It is a quick way to see how much the market is charging for each dollar of profit.
What counts as a “normal” or “fair” P/E depends on what investors expect for future growth and how risky they feel those earnings are. Higher expected growth or lower perceived risk can justify a higher P/E, while lower growth or higher risk usually points to a lower P/E.
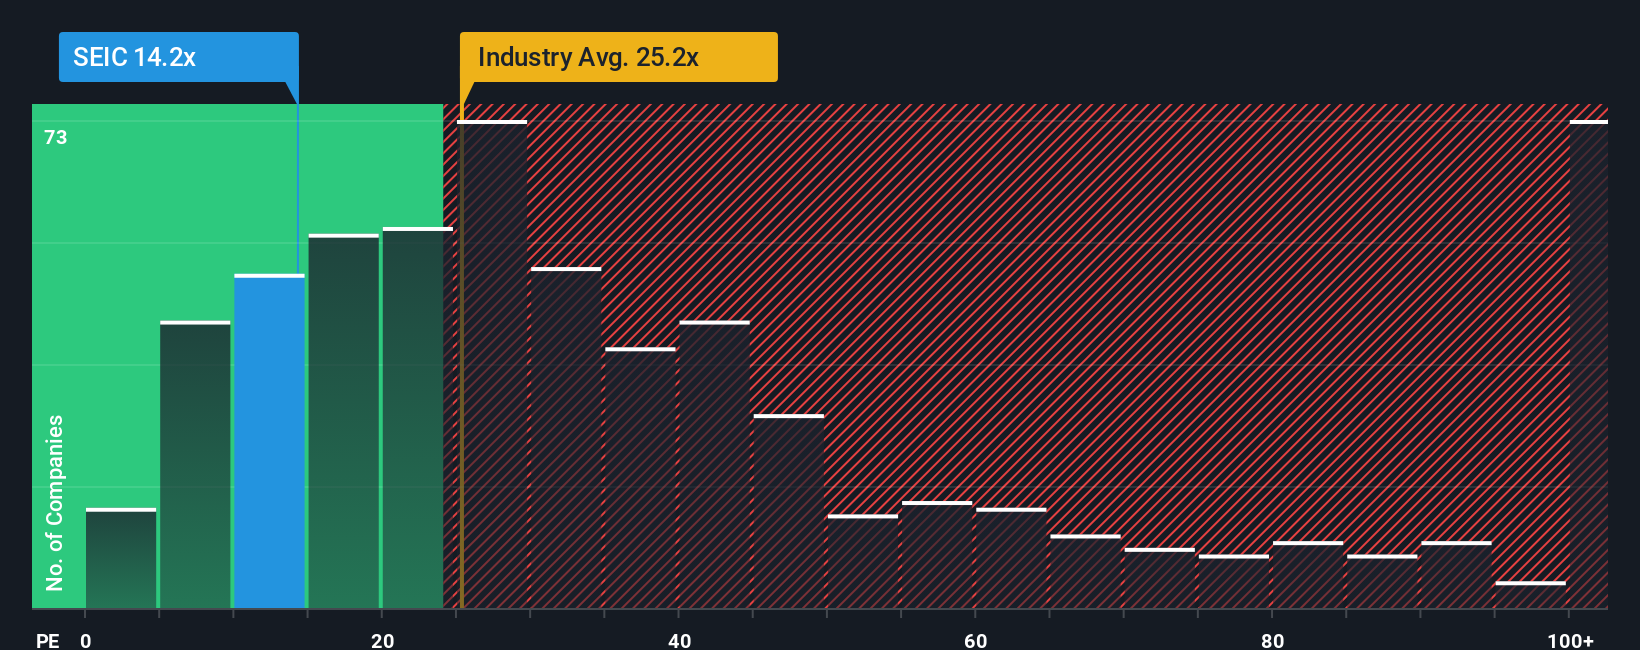
SEI Investments currently trades on a P/E of 14.06x. That sits below the Capital Markets industry average P/E of 23.11x and the peer group average of 19.12x. Simply Wall St’s Fair Ratio for SEI Investments is 14.44x. This Fair Ratio is a proprietary estimate of the P/E you might expect given the company’s earnings profile, industry, profit margins, market cap and risk factors. Because it blends these company specific inputs, it can be more informative than a simple comparison with peers or the broad industry, which may differ on growth or risk.
With the current P/E of 14.06x versus a Fair Ratio of 14.44x, the stock screens as modestly undervalued on this measure.
Result: UNDERVALUED
P/E ratios tell one story, but what if the real opportunity lies elsewhere? Start investing in legacies, not executives. Discover our 23 top founder-led companies.
Upgrade Your Decision Making: Choose your SEI Investments Narrative
Earlier we mentioned that there is an even better way to understand valuation, so let us introduce you to Narratives, which let you attach a simple story about SEI Investments to the numbers you care about, such as your own fair value, revenue, earnings and margin assumptions.
A Narrative connects what you believe about the business to a financial forecast and then to a fair value, so you are not just staring at ratios; you are seeing how your view of the company translates into a price you think is reasonable.
On Simply Wall St, Narratives sit inside the Community page and are used by millions of investors as an easy, accessible tool to compare their Fair Value against the current share price. This can help them decide whether they see SEI Investments as closer to a buy, a hold, or a sell based on their own assumptions.
These Narratives update automatically when new information such as news, buyback activity or earnings is added to the platform, so your fair value view can stay aligned with the latest data without extra work.
For SEI Investments today, one investor might build a bullish Narrative that lines up with a Fair Value near US$115, while another might prefer a more cautious Narrative closer to US$67. Both views can sit side by side so you can see exactly which assumptions are doing the heavy lifting in each case.
For SEI Investments, here are previews of two leading SEI Investments Narratives to make comparison easier:
Fair value in this bullish Narrative: US$103.57 per share
Implied discount to this fair value: about 20.6% below the Narrative fair value, based on the last close of US$82.30
Revenue growth used in this Narrative: 9.35% a year
- Analysts building this view focus on technology platforms, partnerships and outsourced solutions as key drivers for revenue and recurring fees.
- The Narrative leans on disciplined capital allocation, including buybacks, dividends and selective M&A, as support for earnings per share and capital returns.
- It also flags risks around heavy investment needs, fee pressure, competition and client concentration that could weigh on margins if conditions are less supportive.
Fair value in this bearish Narrative: US$67.00 per share
Implied premium to this fair value: about 22.9% above the Narrative fair value, based on the last close of US$82.30
Revenue growth used in this Narrative: 5.42% a year
- This view leans on concerns that dependence on alternative asset administration, private credit servicing and an integrated cash program could face earnings pressure if credit conditions or interest rates shift.
- It also highlights the risk that ongoing spending on technology, client conversions and large banking projects could cap margin progress even if revenues hold up.
- Supporters of this Narrative point to the more cautious analyst cohort, who anchor on a lower P/E and see the current share price as rich compared to what they view as a fair multiple for future earnings.
These Narratives sit at different ends of the current analyst range. This helps illustrate how much your own assumptions about growth, margins and the right P/E can move your view of SEI Investments. If you want to weigh these side by side and then build your own version, Curious how numbers become stories that shape markets? Explore Community Narratives is a good place to start.
Do you think there's more to the story for SEI Investments? Head over to our Community to see what others are saying!

This article by Simply Wall St is general in nature. We provide commentary based on historical data and analyst forecasts only using an unbiased methodology and our articles are not intended to be financial advice. It does not constitute a recommendation to buy or sell any stock, and does not take account of your objectives, or your financial situation. We aim to bring you long-term focused analysis driven by fundamental data. Note that our analysis may not factor in the latest price-sensitive company announcements or qualitative material. Simply Wall St has no position in any stocks mentioned.
Have feedback on this article? Concerned about the content? Get in touch with us directly. Alternatively, email editorial-team@simplywallst.com