

Assessing Cardinal Health (CAH) After A 74% Yearly Surge And Supply Chain Headlines
- If you are looking at Cardinal Health and wondering whether the current price still offers value, this article will walk through what the numbers are really saying.
- The stock last closed at US$220.27, with returns of 1.0% over 7 days, 9.5% over 30 days, 7.1% year to date and 73.7% over the past year, plus very large gains over 3 and 5 years.
- Recent news coverage around Cardinal Health has focused on its role in the healthcare supply chain and ongoing industry wide conversations about drug distribution and medical products. This backdrop helps frame how investors are thinking about both the potential and the risks that might be reflected in these returns.
- On our valuation checklist, Cardinal Health scores 3 out of 6. This suggests some measures indicate value while others look more fully priced. Next we will break down what that means across different valuation approaches, before finishing with a simple framework you can use to make sense of the final verdict.
Approach 1: Cardinal Health Discounted Cash Flow (DCF) Analysis
A Discounted Cash Flow model estimates what a business could be worth today by projecting its future cash flows and then discounting those projections back into today’s dollars. It is essentially asking what the stream of future cash the company might generate is worth right now.
For Cardinal Health, the model used is a 2 Stage Free Cash Flow to Equity approach, based on cash flow projections. The latest twelve month free cash flow is about $5.52b. Analyst inputs and extrapolated estimates suggest free cash flow of $4.49b in 2030, with a series of projections between 2026 and 2035 that Simply Wall St has partly sourced from analysts and partly extended using its own estimates.
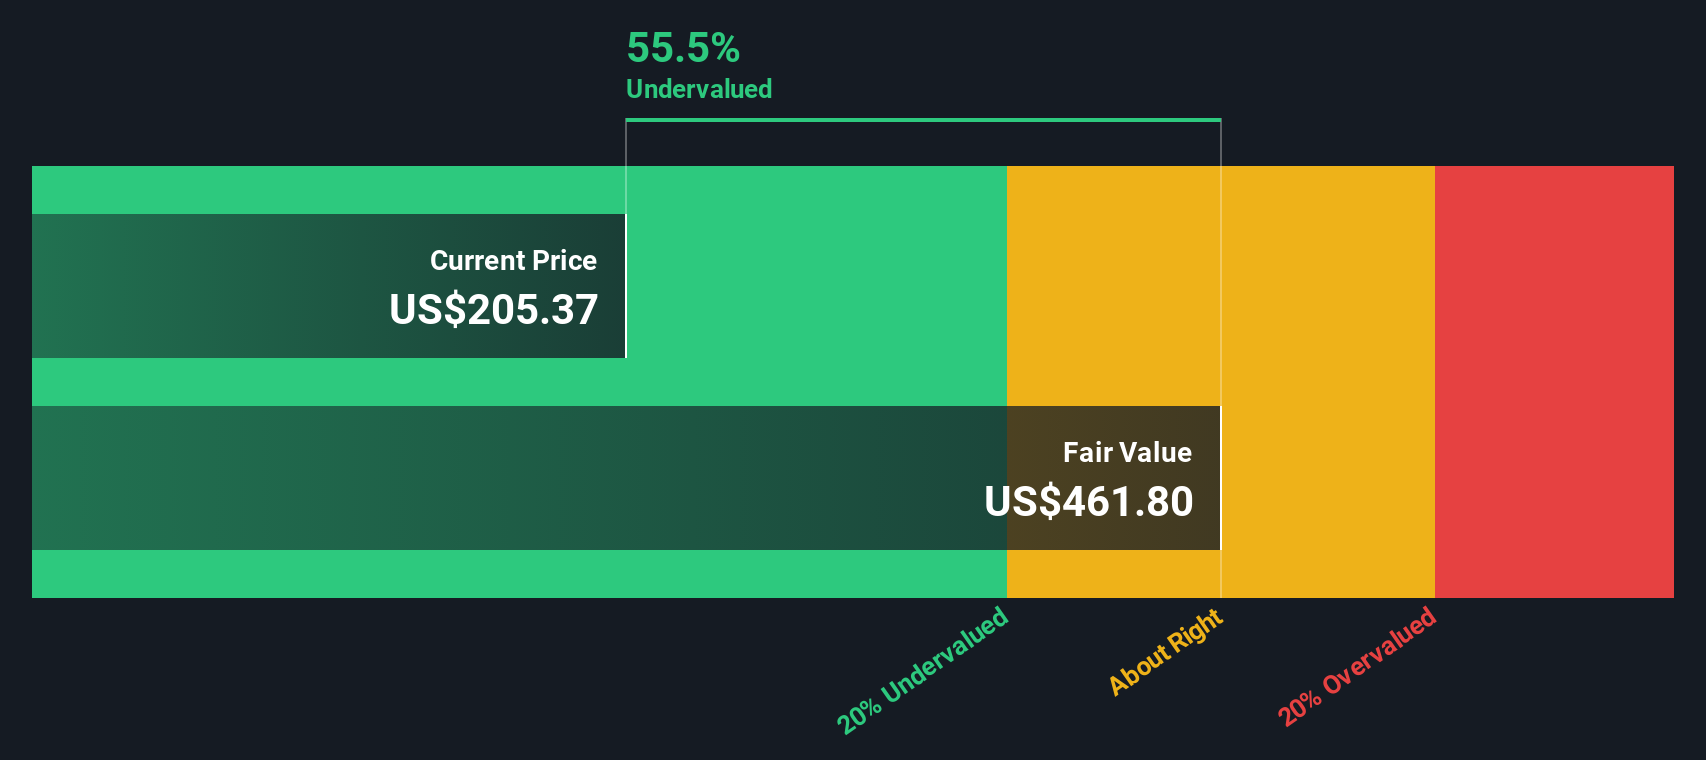
When those projected cash flows are discounted back to today, the DCF model indicates an estimated intrinsic value of about $495.89 per share. Compared with the recent share price of US$220.27, the model output implies the stock is around 55.6% undervalued on this set of assumptions.
Result: UNDERVALUED
Our Discounted Cash Flow (DCF) analysis suggests Cardinal Health is undervalued by 55.6%. Track this in your watchlist or portfolio, or discover 51 more high quality undervalued stocks.
Approach 2: Cardinal Health Price vs Earnings
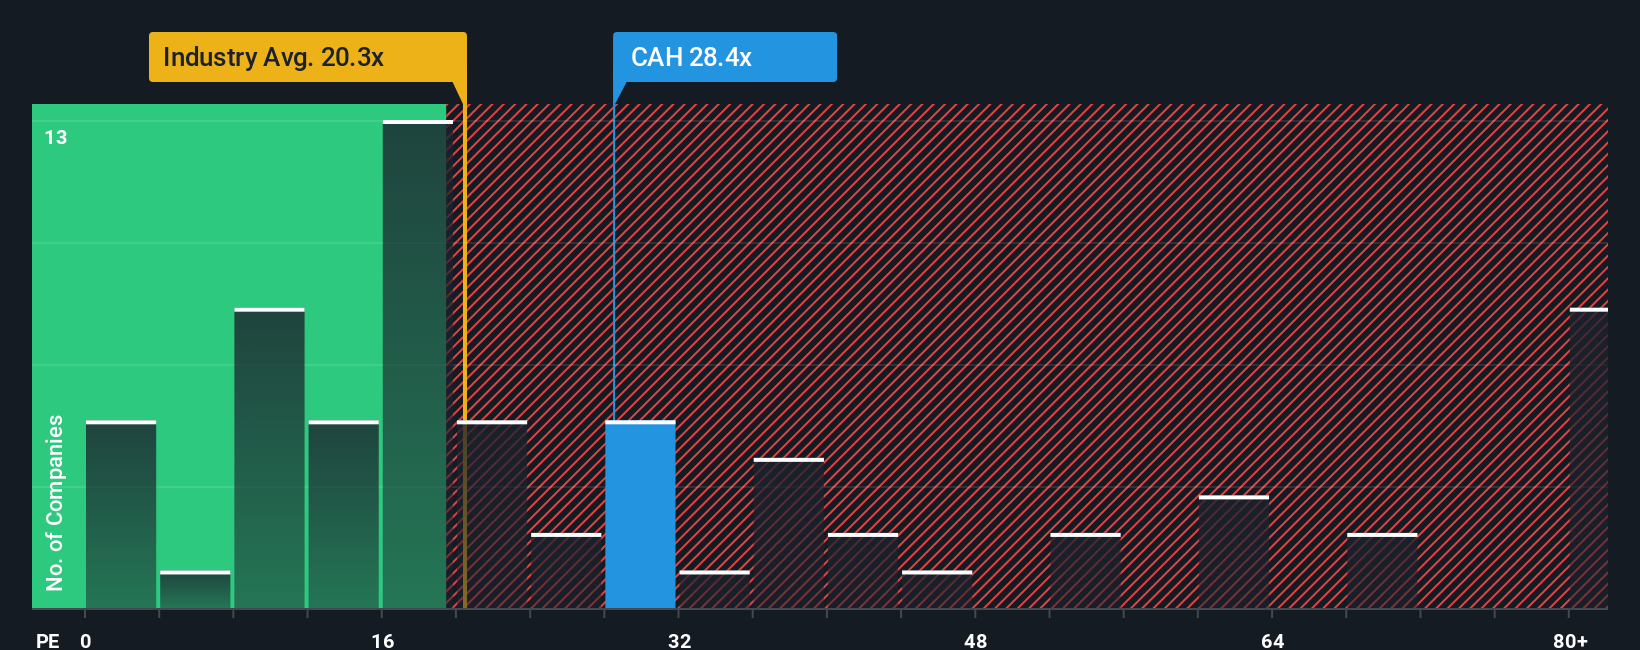
For profitable companies, the P/E ratio is a useful yardstick because it links what you pay per share directly to the earnings the business is currently generating. It gives you a quick sense of how many dollars investors are willing to pay for each dollar of earnings.
What counts as a "normal" P/E often reflects what the market expects for future earnings growth and how much risk investors see in the business. Higher expected growth or lower perceived risk can justify a higher P/E, while slower growth or higher risk usually points to a lower, more conservative multiple.
Cardinal Health currently trades on a P/E of 31.19x. That is above the Healthcare industry average of 23.07x and also slightly above the peer group average of 28.15x. Simply Wall St’s Fair Ratio for Cardinal Health is 31.81x, which is a proprietary estimate of what the P/E could be based on factors like earnings growth, industry, profit margins, market cap and company specific risks. This Fair Ratio can be more tailored than a simple comparison with peers or the industry because it folds all of those elements into a single figure.
With the current P/E of 31.19x sitting very close to the Fair Ratio of 31.81x, the stock appears to be priced at approximately the level indicated by this model.
Result: ABOUT RIGHT
P/E ratios tell one story, but what if the real opportunity lies elsewhere? Start investing in legacies, not executives. Discover our 23 top founder-led companies.
Upgrade Your Decision Making: Choose your Cardinal Health Narrative
Earlier we mentioned that there is an even better way to understand valuation. Let us introduce you to Narratives, which are simple stories you create about Cardinal Health that link your view of its business, your assumptions for future revenue, earnings and margins, and your fair value estimate into one forecast that lives on the Simply Wall St Community page. This forecast updates automatically when new earnings or news arrive and helps you decide whether the current price looks attractive or stretched by comparing your Fair Value with the live market price. For example, one Cardinal Health investor might build a Narrative that leans on growing pharmaceuticals and specialty distribution, efficiency gains and higher margin specialty businesses and lands on a fair value near about US$243 per share. Another might focus more on regulatory pressure, customer concentration and reimbursement risk and settle closer to the low analyst target around US$150. Both views can sit side by side so you can see exactly how different assumptions lead to different decisions.
Do you think there's more to the story for Cardinal Health? Head over to our Community to see what others are saying!

This article by Simply Wall St is general in nature. We provide commentary based on historical data and analyst forecasts only using an unbiased methodology and our articles are not intended to be financial advice. It does not constitute a recommendation to buy or sell any stock, and does not take account of your objectives, or your financial situation. We aim to bring you long-term focused analysis driven by fundamental data. Note that our analysis may not factor in the latest price-sensitive company announcements or qualitative material. Simply Wall St has no position in any stocks mentioned.
Have feedback on this article? Concerned about the content? Get in touch with us directly. Alternatively, email editorial-team@simplywallst.com