

Is It Time To Reassess Dynex Capital (DX) After Recent Share Price Volatility
- If you are wondering whether Dynex Capital is attractively priced or not, this article will walk you through what the current share price might mean for you as an investor.
- Dynex Capital’s stock has had mixed recent returns, with a 1.5% decline over 7 days and a 1.1% decline over 30 days. Yet it stands at a 21.5% return over 1 year, 50.7% over 3 years and 34.2% over 5 years.
- Recent coverage around Dynex Capital has focused on giving investors ongoing context on the business and its share price. This is why this evergreen valuation update has been prepared. This helps put the recent returns into a broader framework so you can judge whether the current price still lines up with your expectations.
- Right now, Dynex Capital has a valuation score of 3 out of 6, which means it screens as undervalued on half of the checks we run. Next, we will look at how different valuation approaches arrive at that view and then finish with an even more practical way to think about value that you can apply yourself.
Approach 1: Dynex Capital Excess Returns Analysis
The Excess Returns model looks at how much profit a company is expected to earn on its equity, after covering the cost of that equity. In simple terms, it asks whether each dollar of shareholder capital is forecast to pull in more value than investors require as compensation for risk.
For Dynex Capital, the model uses a Book Value of $13.47 per share and a Stable EPS of $0.91 per share, based on the median return on equity from the past 5 years. The Cost of Equity is set at $1.05 per share, which leads to an Excess Return of $0.14 per share short of that cost. The Average Return on Equity is 6.76%, and the Stable Book Value is $13.45 per share, drawn from weighted future book value estimates from 4 analysts.
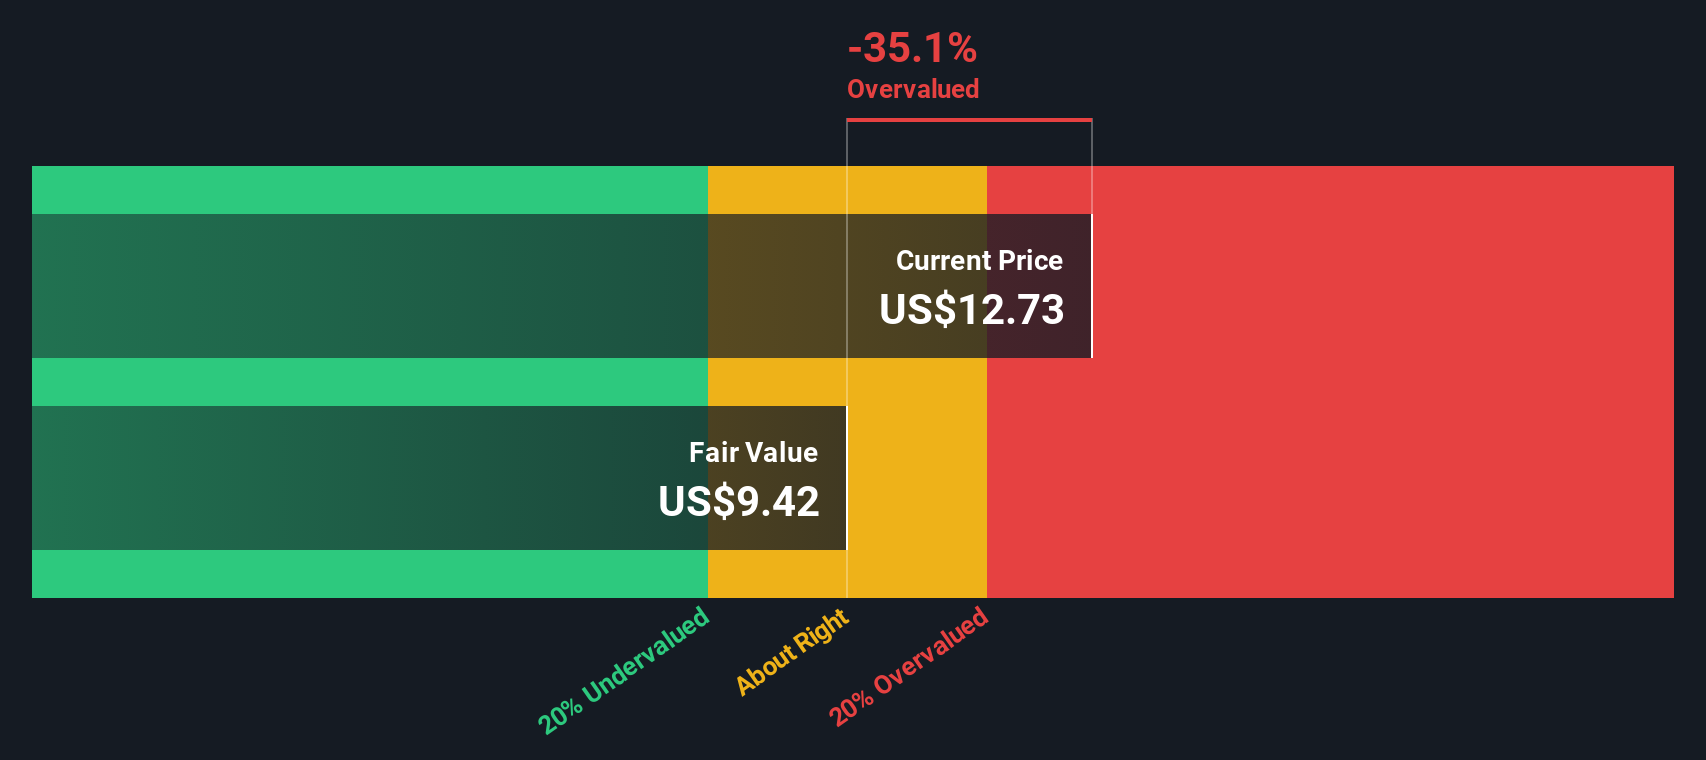
When these inputs are combined in the Excess Returns framework, the estimated intrinsic value per share is $10.20. Compared with the current share price, this indicates that Dynex Capital is trading at a 35.5% premium to the model’s estimate, so it screens as overvalued on this approach.
Result: OVERVALUED
Our Excess Returns analysis suggests Dynex Capital may be overvalued by 35.5%. Discover 51 high quality undervalued stocks or create your own screener to find better value opportunities.
Approach 2: Dynex Capital Price vs Earnings
For profitable companies like Dynex Capital, the P/E ratio is a useful way to relate what you pay for each share to the earnings that share currently generates. It helps you see how many years of current earnings the market is effectively pricing in.
What counts as a normal or fair P/E often reflects how the market views a company’s growth prospects and risk profile. Higher expected growth or lower perceived risk can justify a higher multiple, while slower growth or higher risk usually aligns with a lower one.
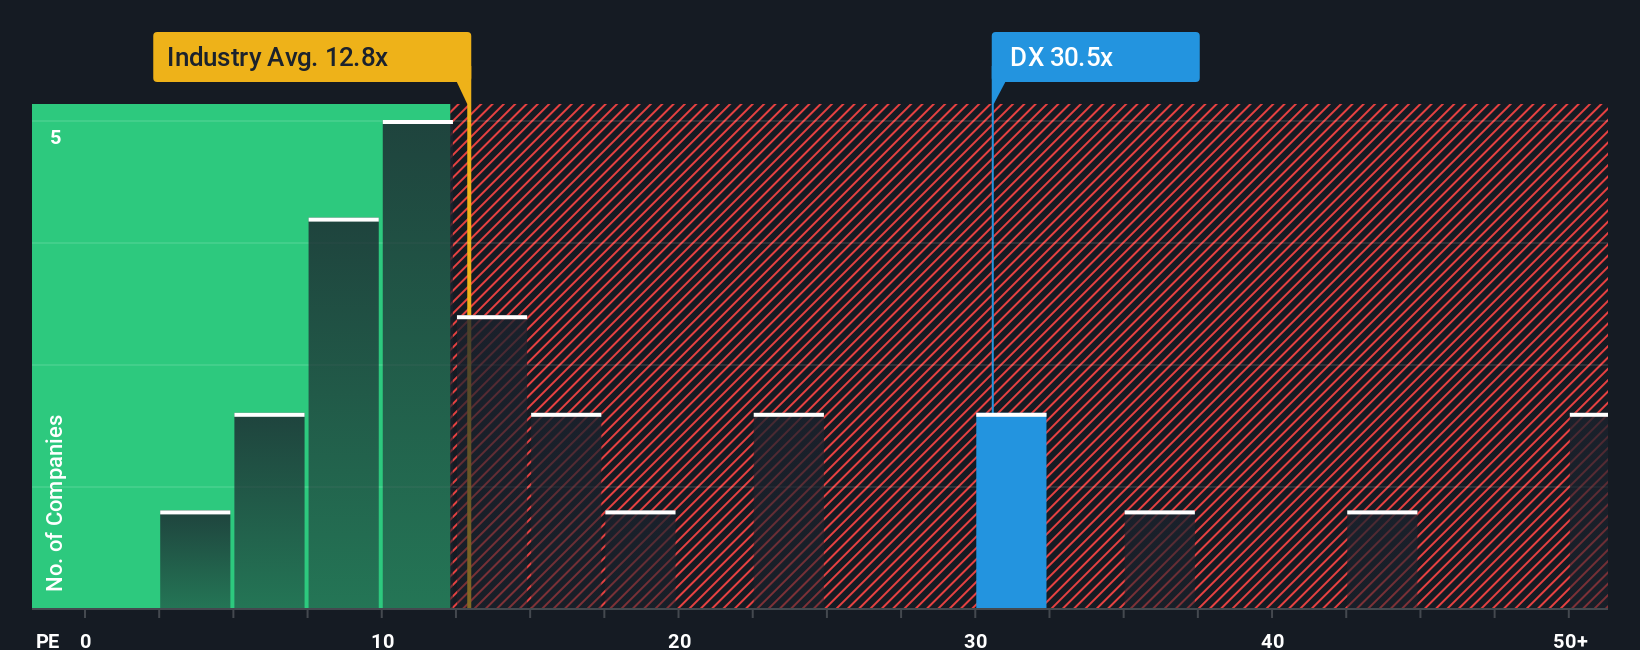
Dynex Capital currently trades at a P/E of 11.95x. That sits just below the Mortgage REITs industry average of 12.02x and below the peer average of 18.68x. Simply Wall St’s Fair Ratio for Dynex Capital is 13.19x, which is its proprietary view of what the P/E could be given factors such as earnings characteristics, industry, profit margins, market cap and company specific risks.
This Fair Ratio can be more tailored than a simple comparison with industry or peer averages because it blends those broader context points with company specific attributes. Comparing the Fair Ratio of 13.19x to the current 11.95x suggests Dynex Capital screens as undervalued on this P/E based approach.
Result: UNDERVALUED
P/E ratios tell one story, but what if the real opportunity lies elsewhere? Start investing in legacies, not executives. Discover our 23 top founder-led companies.
Upgrade Your Decision Making: Choose your Dynex Capital Narrative
Earlier we mentioned that there is an even better way to think about value, and that is through Narratives, which let you spell out the story behind your numbers, including your fair value, and your expectations for Dynex Capital’s future revenue, earnings and margins.
A Narrative connects three things in one place: your view of the business, the forecast that follows from that view, and the fair value that results from those assumptions. On Simply Wall St’s Community page, used by millions of investors, you can see and create Narratives that are easy to tweak so they stay aligned with how you see Dynex Capital.
This can support your decision making, because you can compare your Narrative fair value to the current share price and quickly see whether Dynex Capital appears expensive or cheap to you, given your own assumptions. Narratives also update when fresh information such as news or earnings is added to the platform, so your view is not frozen in time.
For example, one Dynex Capital Narrative might treat the shares as attractive at a relatively low fair value, while another might only see value at a much higher fair value, which shows how different investors can reasonably reach different conclusions from the same data.
Do you think there's more to the story for Dynex Capital? Head over to our Community to see what others are saying!

This article by Simply Wall St is general in nature. We provide commentary based on historical data and analyst forecasts only using an unbiased methodology and our articles are not intended to be financial advice. It does not constitute a recommendation to buy or sell any stock, and does not take account of your objectives, or your financial situation. We aim to bring you long-term focused analysis driven by fundamental data. Note that our analysis may not factor in the latest price-sensitive company announcements or qualitative material. Simply Wall St has no position in any stocks mentioned.
Have feedback on this article? Concerned about the content? Get in touch with us directly. Alternatively, email editorial-team@simplywallst.com