

Kornit Digital (KRNT) Q3 Loss Narrowing Tests Bullish Profitability Narratives
How Kornit Digital's FY 2025 Numbers Frame the Earnings Story
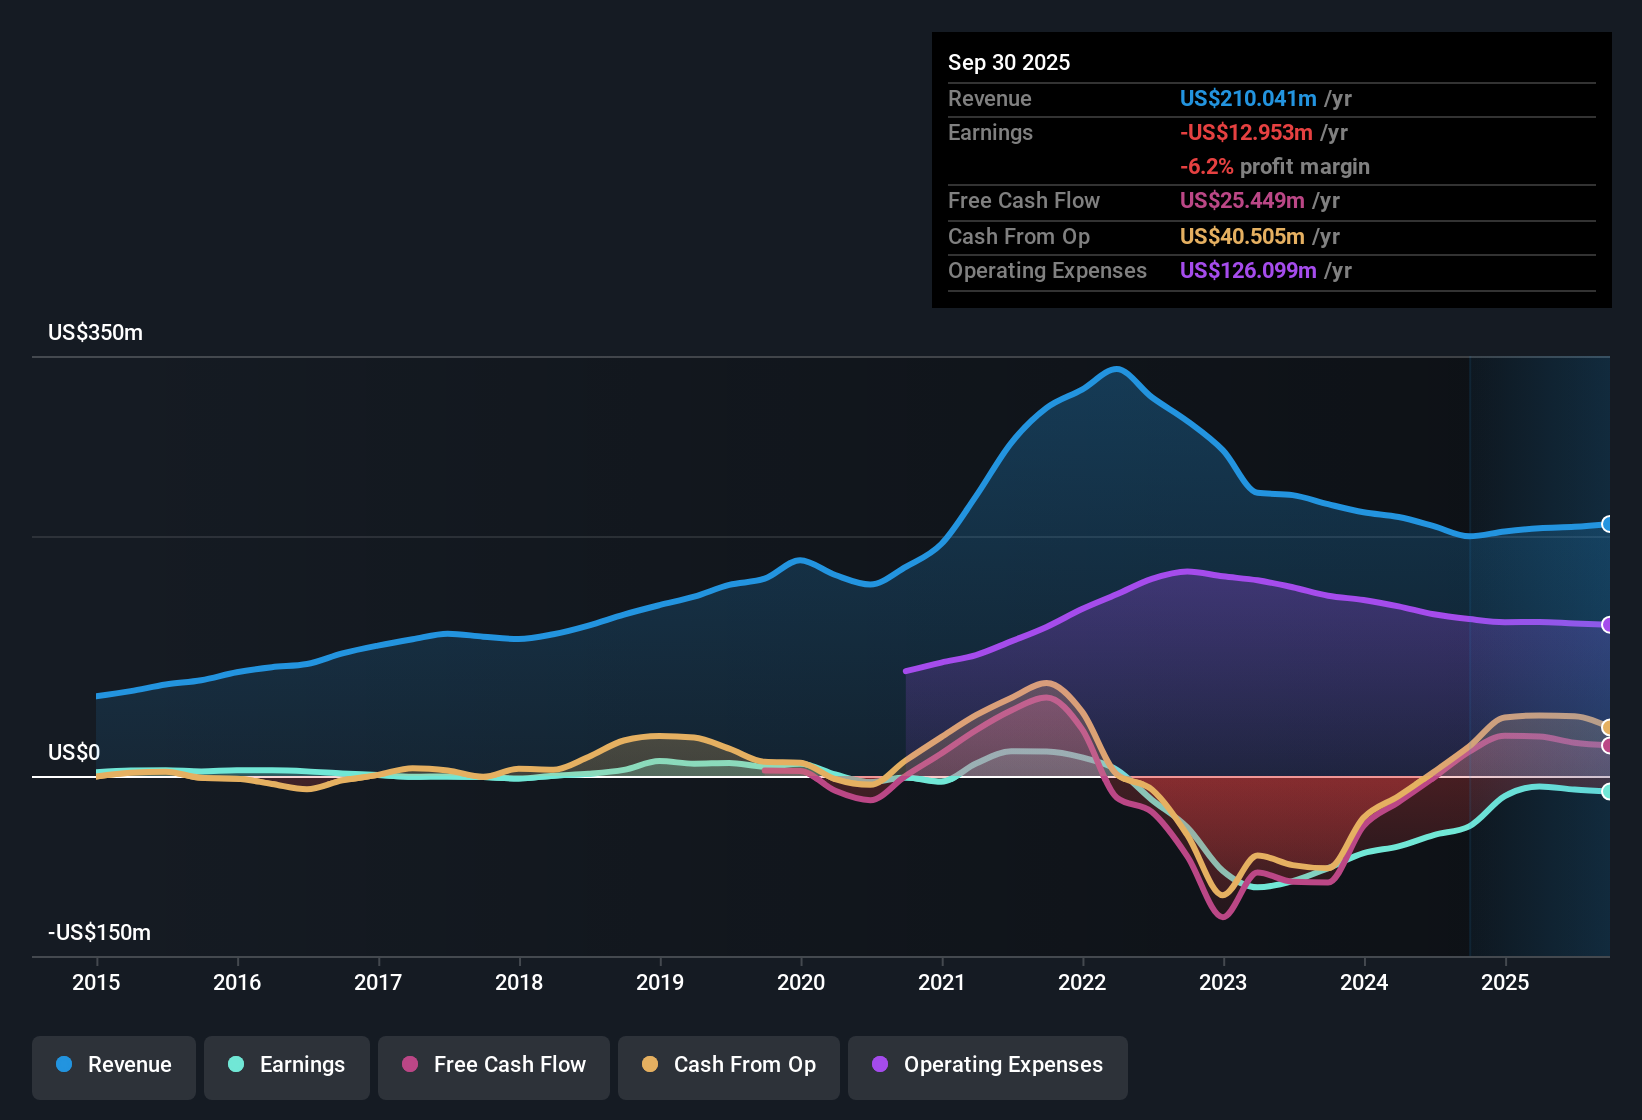
Kornit Digital (NasdaqGS:KRNT) has put fresh numbers on the table for FY 2025, reporting Q3 revenue of US$53.1 million and a basic EPS loss of US$0.06, alongside trailing twelve month revenue of US$210.0 million and a basic EPS loss of US$0.28 that keeps profitability squarely in focus. The company has seen quarterly revenue move from US$60.7 million in Q4 2024 to US$46.5 million in Q1 2025, US$49.8 million in Q2 2025 and US$53.1 million in Q3 2025. Quarterly EPS has shifted from a profit of US$0.05 in Q4 2024 to losses of US$0.11, US$0.17 and US$0.06 across the first three quarters of 2025, setting up an earnings season where investors are likely to scrutinize how much of the top line is translating into sustainable margins.
See our full analysis for Kornit Digital.With the latest figures in hand, the next step is to line them up against the most common narratives around Kornit Digital to see which stories hold up and where the margin picture tells a different tale.
See what the community is saying about Kornit Digital
Losses Persist Despite US$210 Million In TTM Revenue
- Over the last twelve months, Kornit generated US$210.0 million in revenue but recorded a net loss of US$13.0 million and a basic EPS loss of US$0.28, so recent top line scale has not yet translated into profitability.
- Consensus narrative talks up growing recurring revenue from the All-Inclusive Click model and a larger installed base, yet the current loss level and negative EPS suggest that:
- Expectations for more stable, higher margin consumables and services are not fully reflected in trailing earnings, given that the company is still loss making on US$210.0 million of revenue.
- The idea of margin stability sits in tension with the reported twelve month net loss, which points to ongoing cost or mix pressures that the consensus view has to factor in.
Q3 Loss Narrows Compared To Earlier FY 2025
- In FY 2025, Q3 net loss of US$2.6 million and basic EPS loss of US$0.06 compare with losses of US$7.5 million and US$5.1 million, and EPS losses of US$0.17 and US$0.11, in Q2 and Q1 respectively, paired with quarterly revenue between US$46.5 million and US$53.1 million.
- Bulls argue that rising digital adoption and recurring models set Kornit up for stronger margins over time, and the recent quarterly pattern interacts with that view in a few ways:
- The smaller loss in Q3 relative to Q1 and Q2 aligns with the bullish idea that the business model can scale, as revenue has stayed in the US$46.5 million to US$53.1 million range while EPS loss has moved closer to breakeven.
- At the same time, the fact that all three FY 2025 quarters still show losses means the bullish case must assume more progress than the current year to date numbers alone support.
Premium Valuation With Ongoing Profit Deterioration
- Kornit trades on a P/S of 3.8x against a US Machinery industry average of 2.3x and a peer average of 1.6x, while trailing losses have increased at about 23.9% per year over five years and the DCF fair value in the data is US$10.33 per share versus the current share price of US$17.18.
- Bears highlight the risk that paying a premium multiple for a company with worsening profits leaves little room for disappointment, and the supplied figures speak directly to that concern:
- The gap between the current price and the DCF fair value supports the cautious view that the market price is ahead of the cash flow estimate, especially when the company is still unprofitable.
- The combination of a higher P/S than both industry and peers and multi year profit deterioration is consistent with bearish worries about downside risk if future results do not show clearer progress toward earnings strength.
Next Steps
To see how these results tie into long-term growth, risks, and valuation, check out the full range of community narratives for Kornit Digital on Simply Wall St. Add the company to your watchlist or portfolio so you'll be alerted when the story evolves.
See the numbers differently? If this data points you in another direction, turn that view into a clear narrative in just a few minutes and Do it your way
A great starting point for your Kornit Digital research is our analysis highlighting 2 important warning signs that could impact your investment decision.
See What Else Is Out There
Kornit Digital is still loss making on US$210.0 million of trailing revenue, with ongoing EPS losses and a share price above the indicated DCF fair value.
If paying up for a business that is yet to reach profitability makes you cautious, take a look at our 52 high quality undervalued stocks that already combine quality with more conservative pricing.
This article by Simply Wall St is general in nature. We provide commentary based on historical data and analyst forecasts only using an unbiased methodology and our articles are not intended to be financial advice. It does not constitute a recommendation to buy or sell any stock, and does not take account of your objectives, or your financial situation. We aim to bring you long-term focused analysis driven by fundamental data. Note that our analysis may not factor in the latest price-sensitive company announcements or qualitative material. Simply Wall St has no position in any stocks mentioned.
Have feedback on this article? Concerned about the content? Get in touch with us directly. Alternatively, email editorial-team@simplywallst.com