

Assessing Gibraltar Industries (ROCK) Valuation As Earnings Growth Meets Mixed Long Term Shareholder Returns
Gibraltar Industries stock snapshot
Gibraltar Industries (ROCK) has drawn investor attention after recent trading left the shares around $54.12, with mixed return figures across the past week, month and past 3 months, and a value score of 4.
See our latest analysis for Gibraltar Industries.
While the share price is around $54.12 with a year to date share price return of 7.94%, longer term total shareholder returns tell a softer story, including a 1 year total shareholder return decline of 7.15% and a 5 year total shareholder return decline of 44.88%. This suggests that recent momentum may be stabilising after a weaker multi year stretch.
If this has you rethinking where growth could come from next, it might be worth scanning our list of 24 power grid technology and infrastructure stocks as another angle on infrastructure related opportunities.
With Gibraltar Industries posting revenue of about $1.38 billion and net income of roughly $135 million, yet carrying mixed multi-year returns and a value score of 4, is this a mispriced opportunity, or is potential future growth already reflected in the share price?
Preferred P/E of 11.8x: Is it justified?
Gibraltar Industries currently trades on a P/E of 11.8x, which is below both the broader US market and its Building industry peers at recent prices near $54.12.
The P/E ratio compares the current share price to earnings per share, so a lower P/E can indicate that investors are paying less for each dollar of current earnings. For a company with earnings growth of 26.3% over the past year and 12.8% per year over the past 5 years, a discount P/E suggests the market is cautious about how sustainable that profile is.
Against peers, the gap is clear. The P/E of 11.8x is well below the US Building industry average of 23.8x and also below the peer average of 19.1x. It is even below an estimated fair P/E of 20.8x that our models suggest the market could move toward if sentiment and expectations were to align with those inputs.
Explore the SWS fair ratio for Gibraltar Industries
Result: Price-to-Earnings of 11.8x (UNDERVALUED)
However, the 7.2% 1 year and 44.9% 5 year total shareholder return declines, along with a value score of 4, suggest that sentiment could stay cautious.
Find out about the key risks to this Gibraltar Industries narrative.
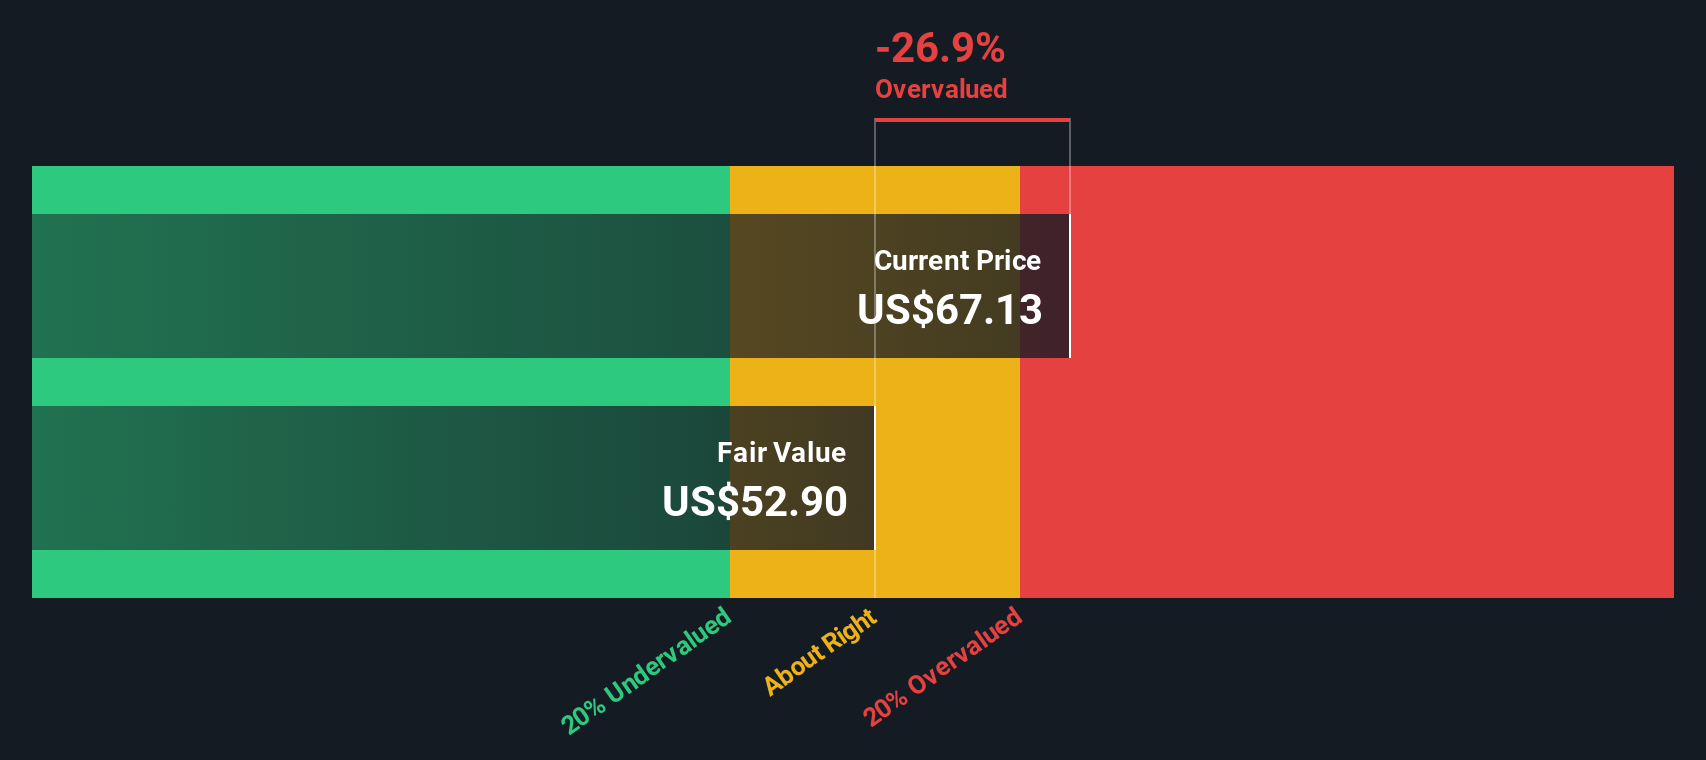
Another angle from our DCF model
While the P/E of 11.8x makes Gibraltar Industries look cheap against peers, our DCF model suggests a different story. In that view, the shares at $54.12 sit above an estimated future cash flow value of $49.62, pointing to a modestly overvalued result instead of a clear bargain.
Look into how the SWS DCF model arrives at its fair value.
Simply Wall St performs a discounted cash flow (DCF) on every stock in the world every day (check out Gibraltar Industries for example). We show the entire calculation in full. You can track the result in your watchlist or portfolio and be alerted when this changes, or use our stock screener to discover 51 high quality undervalued stocks. If you save a screener we even alert you when new companies match - so you never miss a potential opportunity.
Build Your Own Gibraltar Industries Narrative
If you look at these numbers and reach a different conclusion, or simply prefer to test your own view using the same data, you can build a custom Gibraltar Industries storyline in just a few minutes, starting with Do it your way.
A good starting point is our analysis highlighting 5 key rewards investors are optimistic about regarding Gibraltar Industries.
Looking for more investment ideas?
If Gibraltar Industries has sharpened your focus, do not stop here. Use the Simply Wall Street Screener to uncover other opportunities that might suit your style.
- Target potential mispricings by scanning our list of 51 high quality undervalued stocks that pair lower valuations with stronger fundamentals.
- Strengthen your income plan by reviewing 13 dividend fortresses that aim to offer higher yields backed by solid business profiles.
- Tilt your portfolio toward resilience by checking out our 85 resilient stocks with low risk scores selected for comparatively steadier risk characteristics.
This article by Simply Wall St is general in nature. We provide commentary based on historical data and analyst forecasts only using an unbiased methodology and our articles are not intended to be financial advice. It does not constitute a recommendation to buy or sell any stock, and does not take account of your objectives, or your financial situation. We aim to bring you long-term focused analysis driven by fundamental data. Note that our analysis may not factor in the latest price-sensitive company announcements or qualitative material. Simply Wall St has no position in any stocks mentioned.
Have feedback on this article? Concerned about the content? Get in touch with us directly. Alternatively, email editorial-team@simplywallst.com