

Is Universal (UVV) Offering An Opportunity After The Recent 10% Share Price Pullback?
- If you are wondering whether Universal's share price reflects what the business is worth, or if the market is overlooking something important, this article is for you.
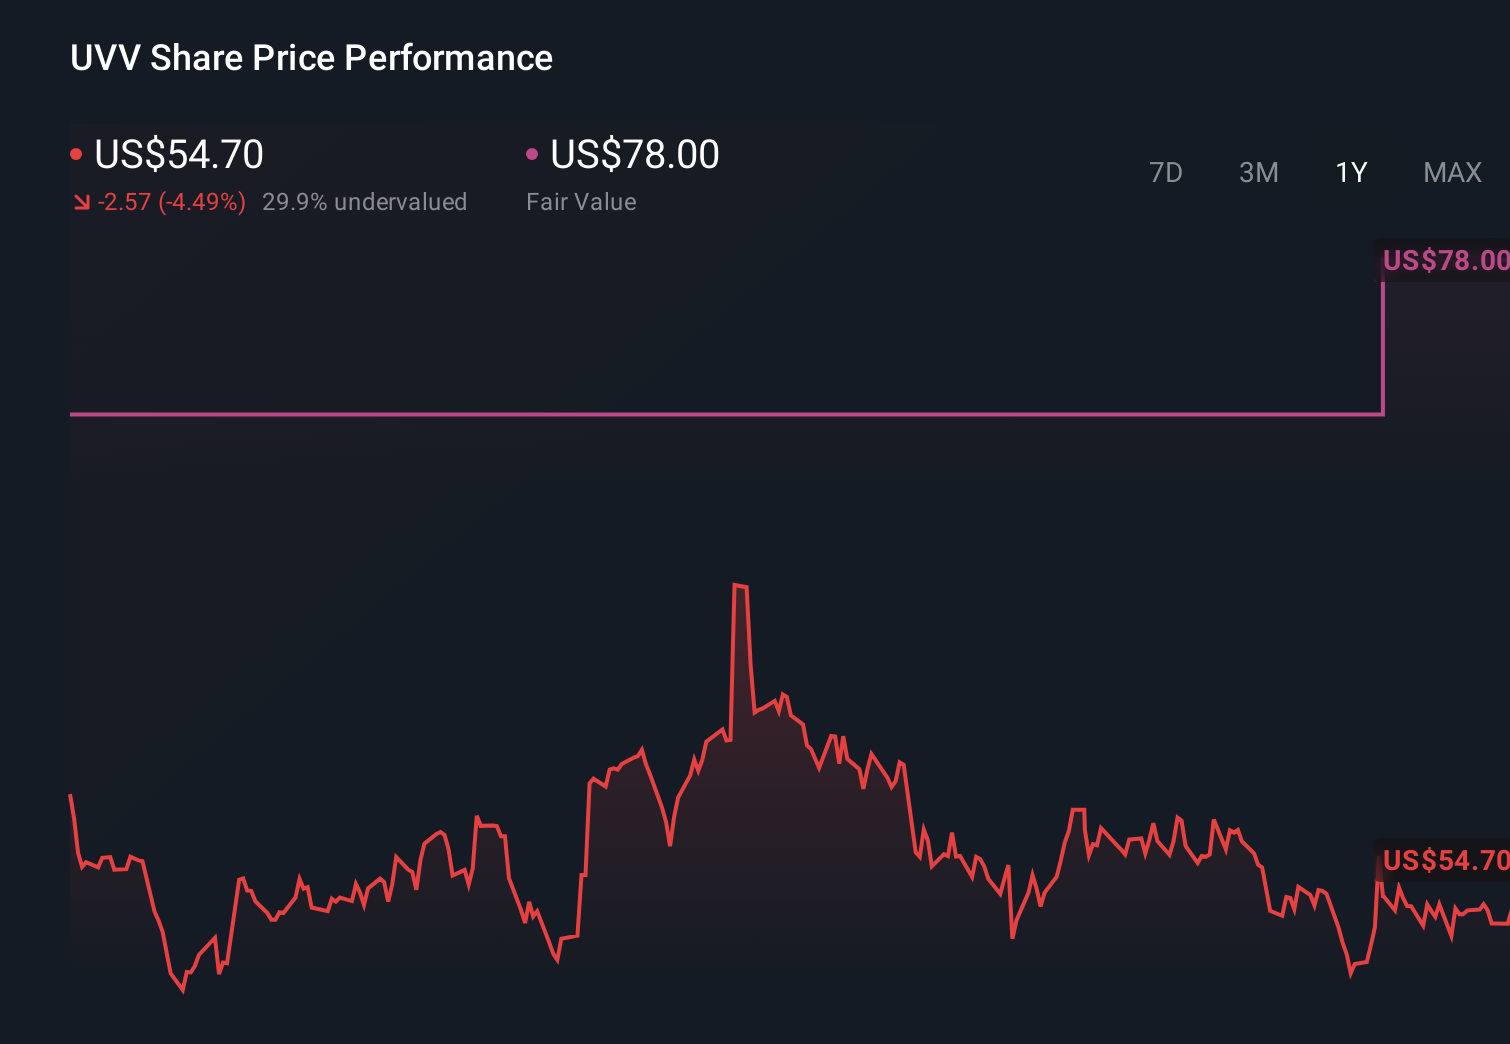
- The stock last closed at US$52.87, with returns of a 10% decline over 7 days, a 2.6% decline over 30 days, 0.6% year to date, 4.8% over 1 year, 19.1% over 3 years and 36.7% over 5 years.
- Recent share price moves have brought Universal back onto investors' radar, especially for those reassessing risk and reward at current levels. This article is intended to provide evergreen coverage of the company, so the aim is to give you context that remains useful beyond any short term headlines.
- On our valuation checks, Universal scores 4 out of 6 for being undervalued. This sets up a closer look at different valuation approaches next, and we will finish with an even better way to think about what that score really means.
Find out why Universal's 4.8% return over the last year is lagging behind its peers.
Approach 1: Universal Discounted Cash Flow (DCF) Analysis
A Discounted Cash Flow, or DCF, model estimates what a company could be worth by projecting its future cash flows and then discounting those back to today using a required rate of return. It is essentially asking what all those future cash flows are worth in today’s dollars.
For Universal, the model uses a 2 Stage Free Cash Flow to Equity approach. The latest twelve month free cash flow is about $38.4m. Analysts provide explicit forecasts for the next few years, then Simply Wall St extrapolates further to build a 10 year path. By 2035, projected free cash flow is $1,093.0m, with each year between 2026 and 2035 discounted back to today.
When all these discounted cash flows are added together, the model arrives at an estimated intrinsic value of about $474.29 per share. Compared with a recent share price of US$52.87, the DCF output suggests the stock is 88.9% below this estimate, which screens as materially undervalued on this method.
Result: UNDERVALUED
Our Discounted Cash Flow (DCF) analysis suggests Universal is undervalued by 88.9%. Track this in your watchlist or portfolio, or discover 51 more high quality undervalued stocks.
Approach 2: Universal Price vs Earnings
For a profitable company like Universal, the P/E ratio is a useful cross check because it links what you pay per share directly to the earnings that support that price. Investors generally expect higher P/E ratios when they see stronger growth potential or lower risk, and lower P/E ratios when growth is more modest or risks are higher.
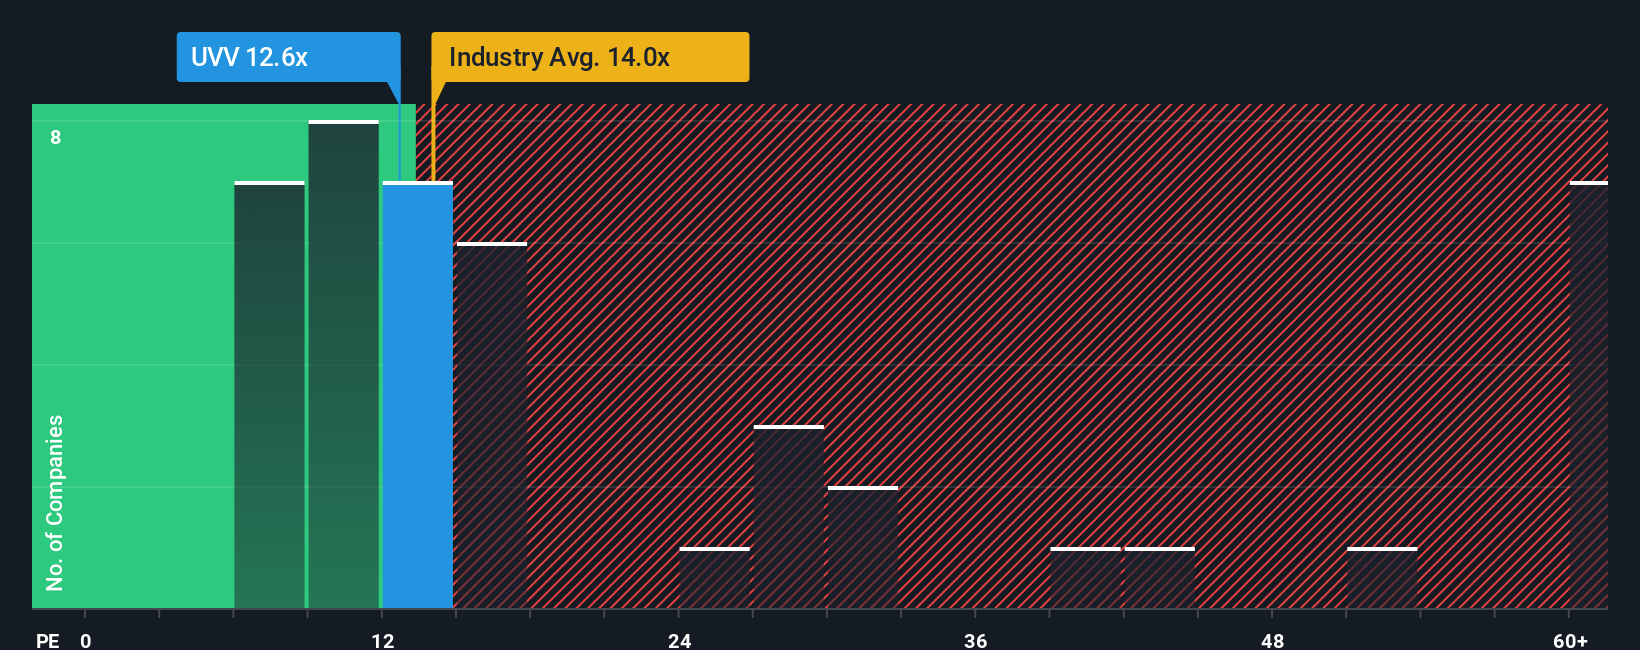
Universal currently trades on a P/E of 15.46x. That sits close to the Tobacco industry average of 15.05x, and below the peer average of 38.24x. On the surface, that suggests the market prices Universal more conservatively than many peers, but roughly in line with the broader industry.
Simply Wall St also calculates a Fair Ratio of 17.81x, which is the P/E level its model would expect for Universal after weighing factors such as earnings growth, industry, profit margins, market cap and company specific risks. This Fair Ratio can be more informative than a simple peer or industry comparison because it is tailored to Universal rather than relying on broad group averages. Comparing 17.81x to the actual 15.46x indicates the shares screen as undervalued on this metric.
Result: UNDERVALUED
P/E ratios tell one story, but what if the real opportunity lies elsewhere? Start investing in legacies, not executives. Discover our 22 top founder-led companies.
Upgrade Your Decision Making: Choose your Universal Narrative
Earlier we mentioned that there is an even better way to understand valuation, so let us introduce Narratives, which are simply your own story about Universal that links what you believe about its future revenue, earnings and margins to a financial forecast and a fair value that you can compare with today’s price.
On Simply Wall St’s Community page, Narratives let you plug in assumptions such as whether Universal’s long term demand is supported by ESG aligned supply chains or held back by risks like tobacco oversupply, tariff uncertainty and execution in ingredients. Narratives then translate that story into numbers that update automatically when new earnings or news arrives.
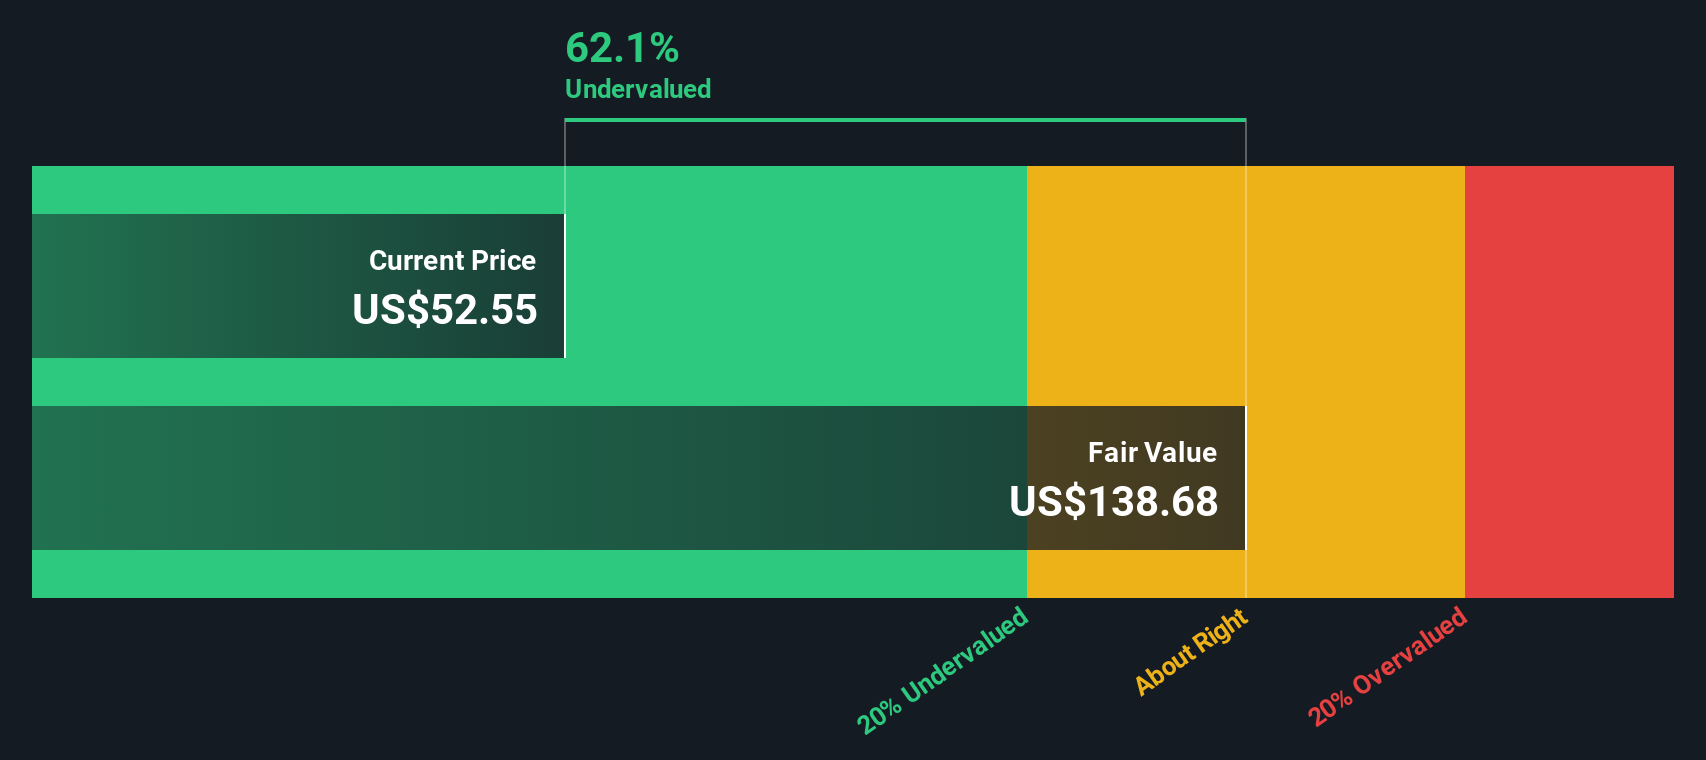
For example, one Universal Narrative might lean closer to the current Fair Value of US$78 based on expectations for 3.27% revenue growth, a 4.84% profit margin and a future P/E of 16.35x. A more cautious Narrative might anchor nearer the current share price if you place more weight on margin pressure, diversification risk and leadership transition. Comparing these different fair values with the live market price can help you decide whether Universal looks more like a hold for you today or a candidate to watch for a better entry or exit point.
Do you think there's more to the story for Universal? Head over to our Community to see what others are saying!
This article by Simply Wall St is general in nature. We provide commentary based on historical data and analyst forecasts only using an unbiased methodology and our articles are not intended to be financial advice. It does not constitute a recommendation to buy or sell any stock, and does not take account of your objectives, or your financial situation. We aim to bring you long-term focused analysis driven by fundamental data. Note that our analysis may not factor in the latest price-sensitive company announcements or qualitative material. Simply Wall St has no position in any stocks mentioned.
Have feedback on this article? Concerned about the content? Get in touch with us directly. Alternatively, email editorial-team@simplywallst.com