

Assessing Cincinnati Financial (CINF) Valuation After Recent Share Price Pullback
Event context and recent share performance
Cincinnati Financial (CINF) has been drawing attention after a period of mixed short term returns, with a slight gain over the past month, a small decline over the past 3 months, and a stronger 1 year total return.
See our latest analysis for Cincinnati Financial.
With the share price at US$163.46, Cincinnati Financial’s recent 7 day share price return of a 4.7% decline contrasts with its 1 year total shareholder return of about 21.9%, hinting that long term momentum remains stronger than the latest pullback.
If this insurance stock has you thinking about where else returns might come from, it could be worth checking out our screener of 22 top founder-led companies as potential next ideas.
With Cincinnati Financial now trading around US$163.46, a modest discount to the US$174.60 analyst target and an intrinsic value that screens as slightly rich, you have to ask: is there still a buying opportunity here, or is the market already pricing in future growth?
Most Popular Narrative: 6.5% Undervalued
At a last close of $163.46 versus a narrative fair value of $174.80, the current price sits below what this widely followed model suggests, which is why the underlying assumptions matter.
The analysts have a consensus price target of $163.333 for Cincinnati Financial based on their expectations of its future earnings growth, profit margins and other risk factors. However, there is a degree of disagreement amongst analysts, with the most bullish reporting a price target of $175.0, and the most bearish reporting a price target of just $145.0.
Want to see what sits behind that gap between fair value, bullish and bearish targets? Revenue, earnings and margins are all pulling in different directions. The narrative ties them together into one clear earnings and valuation path. Curious which assumptions really carry the weight in that $174.80 figure?
Result: Fair Value of $174.80 (UNDERVALUED)
Have a read of the narrative in full and understand what's behind the forecasts.
However, those fair value assumptions could be knocked off course if catastrophe losses stay elevated or if pricing competition and regulatory costs squeeze underwriting margins faster than expected.
Find out about the key risks to this Cincinnati Financial narrative.
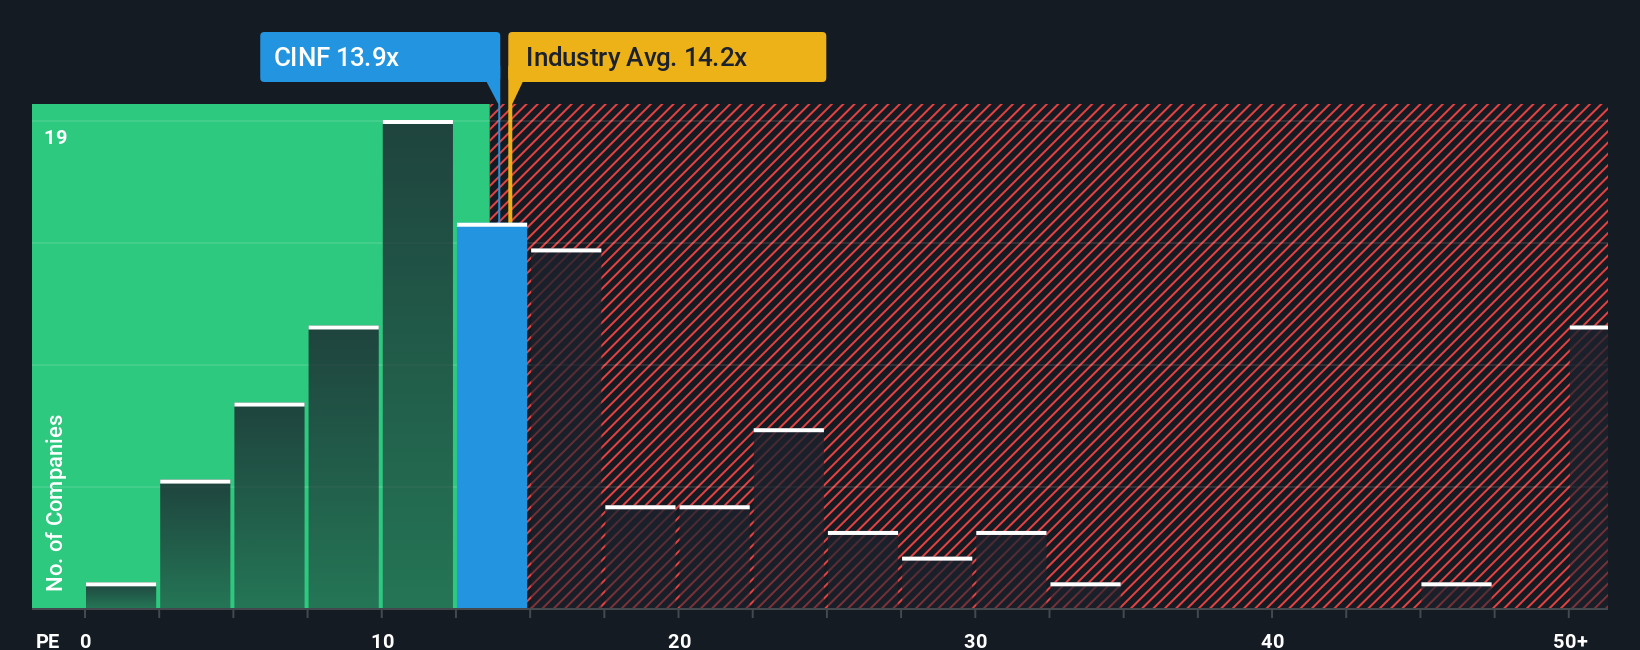
Another angle on price: earnings multiple vs fair ratio
That 6.5% gap to the $174.80 fair value sits beside a more cautious signal. At a P/E of 10.6x, Cincinnati Financial trades below the US Insurance average of 12.6x and the 12.4x peer average, but well above its fair ratio of 6.8x, which suggests less room for error if earnings disappoint.
See what the numbers say about this price — find out in our valuation breakdown.
Build Your Own Cincinnati Financial Narrative
If you do not fully agree with this storyline or prefer to rely on your own work, you can pull the same data, test different assumptions and build a custom thesis for Cincinnati Financial in just a few minutes, then Do it your way.
A great starting point for your Cincinnati Financial research is our analysis highlighting 3 key rewards and 1 important warning sign that could impact your investment decision.
Ready for more investment ideas?
If Cincinnati Financial is on your radar, do not stop there. A few minutes with a focused screener could surface ideas that fit your goals even better.
- Target reliable income by scanning companies in our list of 13 dividend fortresses that may suit investors who value consistent cash returns.
- Hunt for value by reviewing 51 high quality undervalued stocks that combine strong fundamentals with prices that screen below their estimated worth.
- Prioritise resilience by checking 85 resilient stocks with low risk scores that score well on stability factors and may help balance more volatile positions.
This article by Simply Wall St is general in nature. We provide commentary based on historical data and analyst forecasts only using an unbiased methodology and our articles are not intended to be financial advice. It does not constitute a recommendation to buy or sell any stock, and does not take account of your objectives, or your financial situation. We aim to bring you long-term focused analysis driven by fundamental data. Note that our analysis may not factor in the latest price-sensitive company announcements or qualitative material. Simply Wall St has no position in any stocks mentioned.
Have feedback on this article? Concerned about the content? Get in touch with us directly. Alternatively, email editorial-team@simplywallst.com