

Is Kulicke And Soffa (KLIC) Pricing In Too Much Optimism After Its Recent Surge
- If you are wondering whether Kulicke and Soffa Industries at around US$74.87 is starting to look expensive or still offers value, you are not alone.
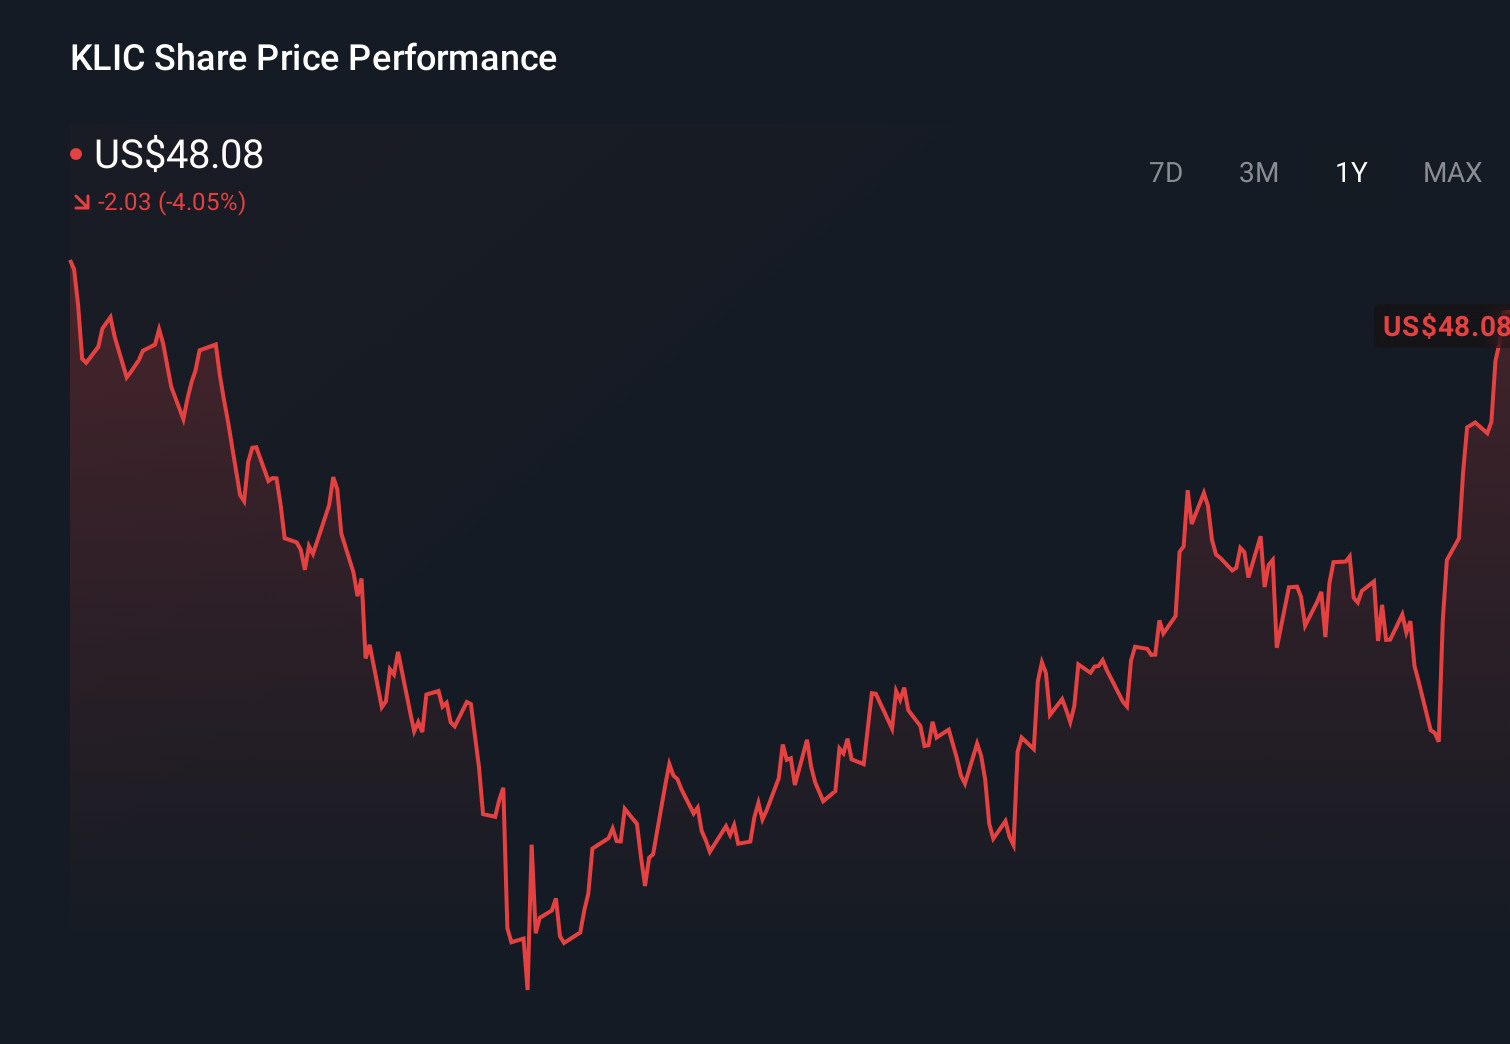
- The stock has moved sharply, with returns of 34.5% over the last 7 days, 32.9% over 30 days, 54.9% year to date, 88.4% over 1 year, 43.5% over 3 years, and 55.3% over 5 years.
- Recent news coverage has focused on the company as part of broader discussions around semiconductor equipment names. This helps explain why some investors are paying closer attention to the stock. Commentary has largely centered on how specialist chip suppliers are being reassessed as investors weigh long term demand for semiconductor manufacturing capacity.
- Despite the strong share price moves, Kulicke and Soffa Industries currently has a valuation score of 1 out of 6. In this article we will walk through what different valuation approaches say about the stock, then finish with a way to look at valuation that can be even more useful than any single model.
Kulicke and Soffa Industries scores just 1/6 on our valuation checks. See what other red flags we found in the full valuation breakdown.
Approach 1: Kulicke and Soffa Industries Discounted Cash Flow (DCF) Analysis
A Discounted Cash Flow model takes estimates of a company’s future cash flows and discounts them back to today using a required rate of return, to arrive at an estimate of what the entire business might be worth per share.
For Kulicke and Soffa Industries, the model used here is a 2 Stage Free Cash Flow to Equity approach based on cash flow projections. The company’s latest twelve month Free Cash Flow is about $64.4 million. Analysts have provided near term estimates, such as $147.1 million in 2026 and $95.5 million in 2027, and Simply Wall St extends this with extrapolated figures out to 2035, all in $. Each of those future cash flows is discounted back to today and then combined to give an estimated intrinsic value per share.
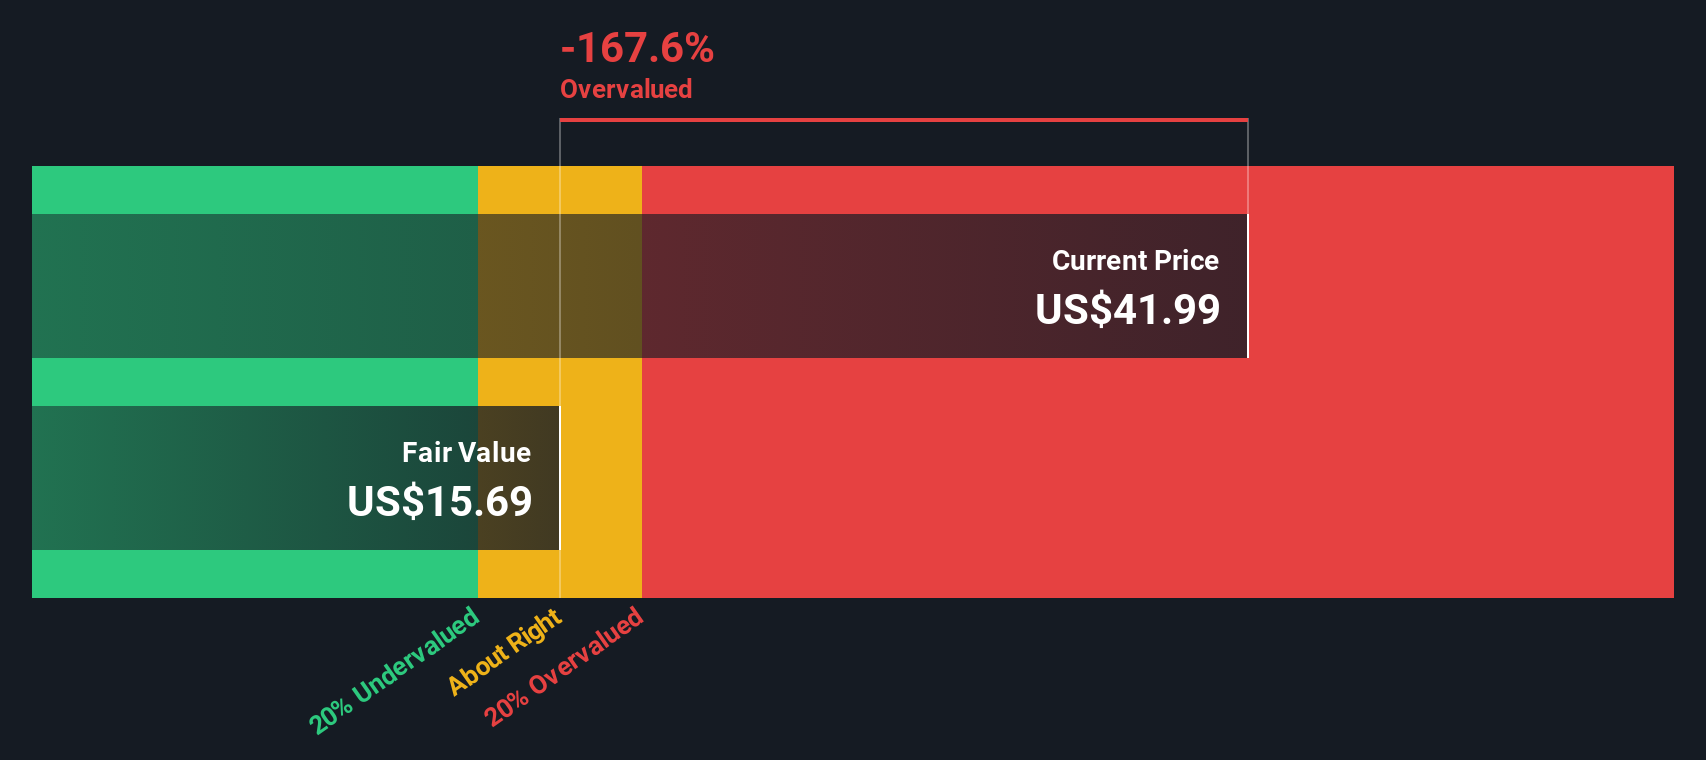
On this basis, the DCF model suggests an intrinsic value of about $13.71 per share, compared with a current share price of around $74.87. That gap implies the stock is very expensive relative to this particular cash flow model, with the DCF indicating it is roughly 446.2% overvalued.
Result: OVERVALUED
Our Discounted Cash Flow (DCF) analysis suggests Kulicke and Soffa Industries may be overvalued by 446.2%. Discover 51 high quality undervalued stocks or create your own screener to find better value opportunities.
Approach 2: Kulicke and Soffa Industries Price vs Sales
For many hardware and semiconductor equipment companies, P/S is often a practical yardstick because revenue is typically less volatile than earnings and less affected by one off items. It can give you a clearer sense of what the market is willing to pay for each dollar of sales.
What counts as a normal or fair P/S often reflects how investors see the company’s growth potential and risk profile. Higher expected growth or lower perceived risk can support a higher multiple, while slower growth or higher risk usually calls for a lower one.
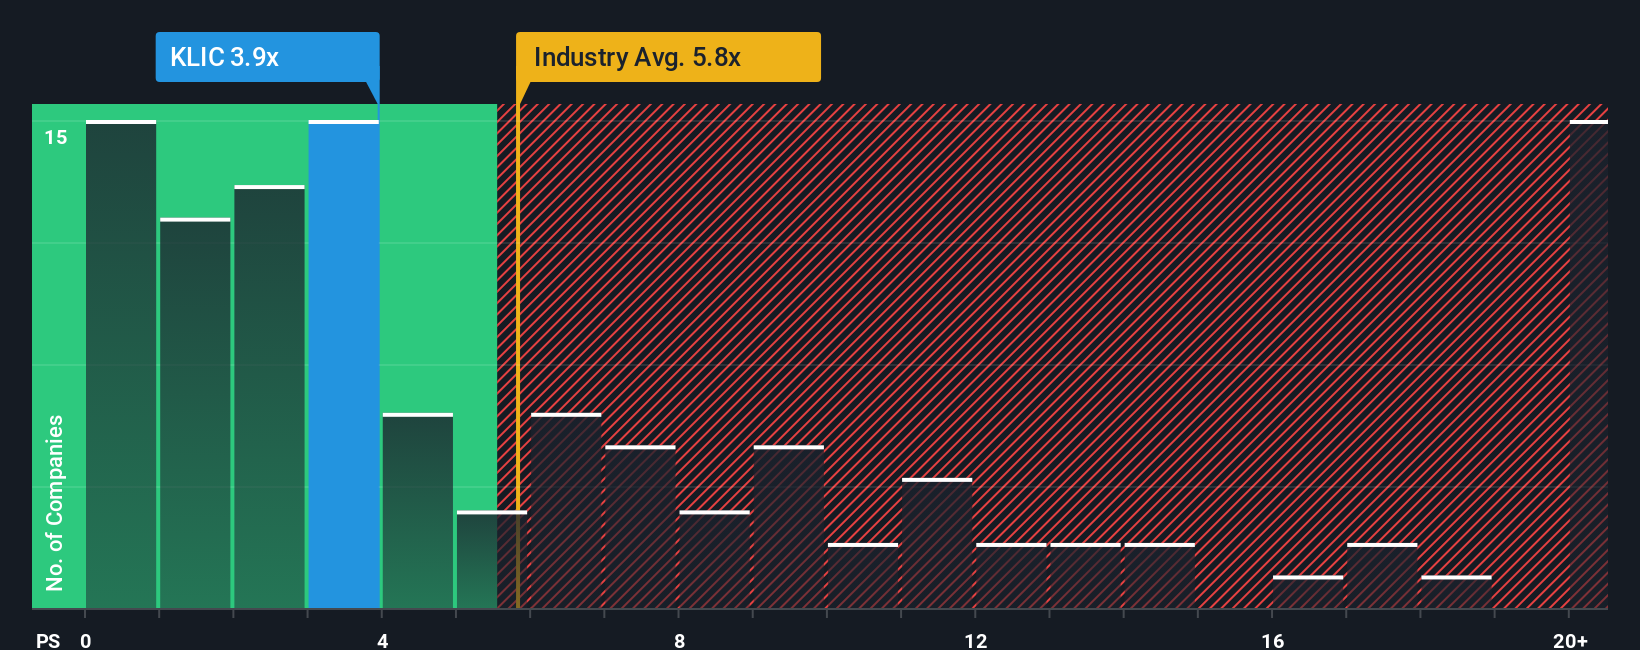
Kulicke and Soffa Industries currently trades on a P/S of 5.70x. That sits below the wider Semiconductor industry average of 6.22x but above the peer group average of 2.86x. Simply Wall St’s Fair Ratio for the stock is 5.18x, which is its proprietary estimate of what the P/S could be given factors such as the company’s earnings profile, margins, size, industry and specific risks.
Because the Fair Ratio blends these elements directly for Kulicke and Soffa Industries, it can be more tailored than a simple comparison with broad industry or peer averages. With the actual P/S at 5.70x versus a Fair Ratio of 5.18x, the shares appear expensive relative to this model.
Result: OVERVALUED
P/S ratios tell one story, but what if the real opportunity lies elsewhere? Start investing in legacies, not executives. Discover our 22 top founder-led companies.
Upgrade Your Decision Making: Choose your Kulicke and Soffa Industries Narrative
Earlier we mentioned that there is an even better way to understand valuation, so let us introduce you to Narratives. These let you pair a clear story about Kulicke and Soffa Industries with specific assumptions for future revenue, earnings, margins and a fair value, then track how that stacks up against the current share price.
On Simply Wall St’s Community page, Narratives are an easy tool used by millions of investors to set out their view of a company, link that story to a financial forecast, and see a resulting fair value that updates automatically when fresh news or earnings are added.
You might, for example, lean toward a more cautious Kulicke and Soffa Industries Narrative that lines up with a fair value around US$39.00, or instead lean toward a more optimistic view closer to US$55.00. By comparing each Narrative’s fair value with today’s market price you can decide whether it looks like a potential opportunity or something to be patient with, based on your own assumptions rather than anyone else’s.
Do you think there's more to the story for Kulicke and Soffa Industries? Head over to our Community to see what others are saying!
This article by Simply Wall St is general in nature. We provide commentary based on historical data and analyst forecasts only using an unbiased methodology and our articles are not intended to be financial advice. It does not constitute a recommendation to buy or sell any stock, and does not take account of your objectives, or your financial situation. We aim to bring you long-term focused analysis driven by fundamental data. Note that our analysis may not factor in the latest price-sensitive company announcements or qualitative material. Simply Wall St has no position in any stocks mentioned.
Have feedback on this article? Concerned about the content? Get in touch with us directly. Alternatively, email editorial-team@simplywallst.com