

Is It Time To Reassess Himax Technologies (HIMX) After Its Recent Share Price Move?
- Wondering whether Himax Technologies at US$8.25 is priced for opportunity or already reflecting its prospects? This article walks you through what the current market price might be saying about the stock.
- The share price has moved 9.3% over the last 7 days. Returns of a 0.7% decline over 30 days and a 3.3% decline year to date, alongside a 6.2% decline over 1 year, sit against a 13.8% gain over 3 years and a 26.4% decline over 5 years.
- Recent attention on Himax has been shaped by ongoing interest in semiconductor names and how investors are weighing near term demand against longer term opportunities. This mix of shorter and longer horizon returns can influence how the market is currently thinking about risk and reward for the stock.
- On our checks, Himax scores 3 out of 6 on valuation, as shown in its valuation score. Next we will look at what different valuation methods say about that price, and then finish with a framework that can help you read those numbers with even more clarity.
Find out why Himax Technologies's -6.2% return over the last year is lagging behind its peers.
Approach 1: Himax Technologies Discounted Cash Flow (DCF) Analysis
A Discounted Cash Flow, or DCF, model projects a company’s future cash flows and then discounts them back to today’s value to estimate what the business might be worth per share right now.
For Himax Technologies, the model used is a 2 Stage Free Cash Flow to Equity approach. The latest twelve month free cash flow is reported at about $141.05 million, and analysts provide an explicit forecast of $58.65 million for 2026. Beyond that, Simply Wall St extrapolates free cash flow out to 2035, with each future cash flow discounted back using the model’s assumptions.
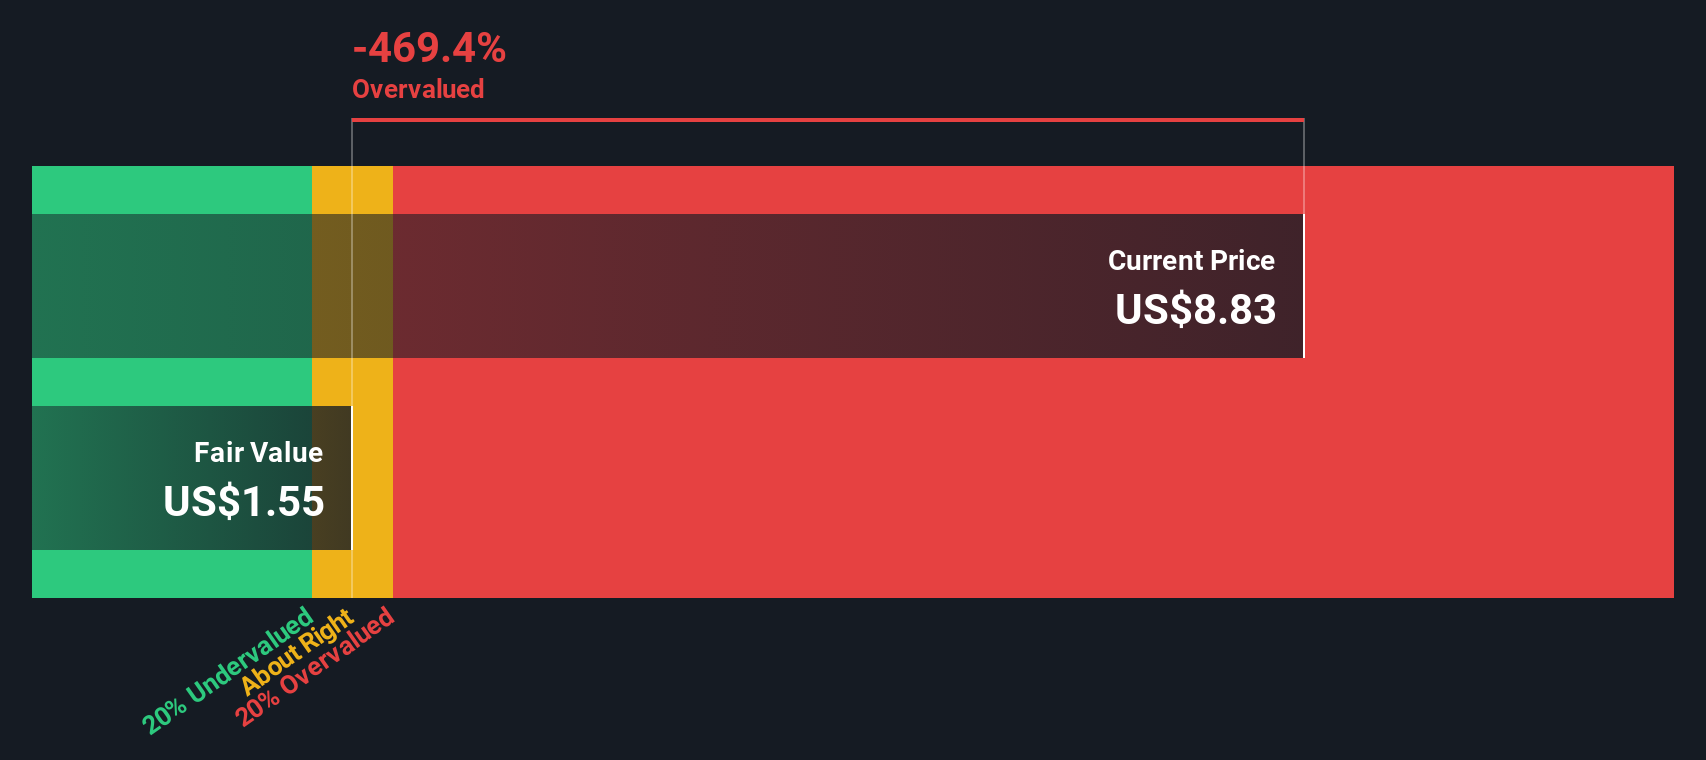
When all those discounted cash flows are added together and allocated across the share count, the DCF model arrives at an estimated intrinsic value of roughly $1.88 per share. Compared with the current share price of about $8.25, this implies the stock is very expensive on this set of cash flow assumptions, with the intrinsic discount figure indicating it is 338.6% overvalued.
Result: OVERVALUED
Our Discounted Cash Flow (DCF) analysis suggests Himax Technologies may be overvalued by 338.6%. Discover 51 high quality undervalued stocks or create your own screener to find better value opportunities.
Approach 2: Himax Technologies Price vs Earnings
For profitable companies, the P/E ratio is a useful way to link what you pay for a share to the earnings that support it. It helps you see how many dollars of price the market is willing to pay for each dollar of current earnings.
What counts as a “normal” P/E often reflects how the market views a company’s growth potential and risks. Higher expected growth or lower perceived risk tends to justify a higher P/E, while slower growth or higher risk usually points to a lower multiple being reasonable.
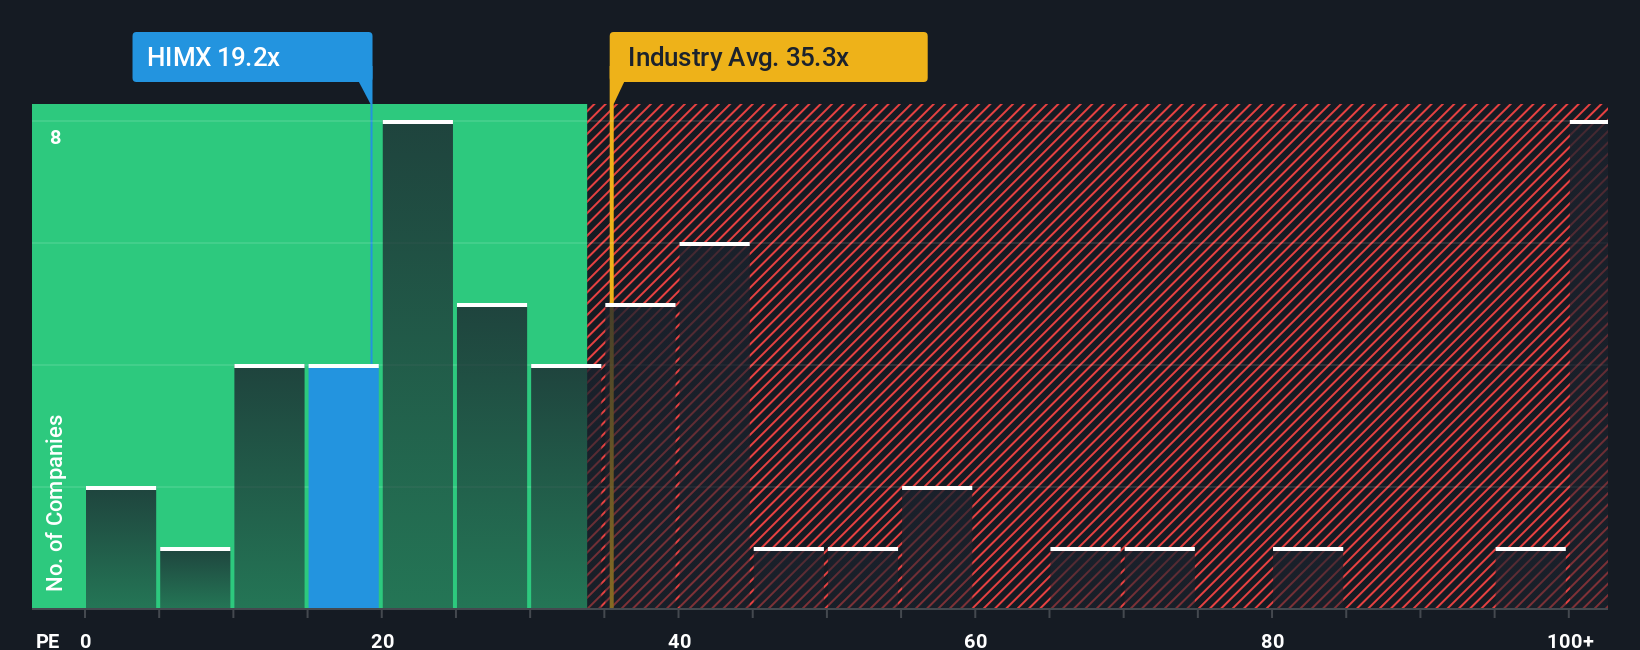
Himax Technologies currently trades on a P/E of about 23.20x. That sits below the Semiconductor industry average of 46.42x and below the peer group average of 75.12x. Simply Wall St’s Fair Ratio for Himax is 31.69x, which is its proprietary estimate of what a more appropriate P/E might be, after considering factors such as earnings growth characteristics, profit margins, industry, market cap and company specific risks.
This Fair Ratio can be more informative than a simple comparison with peers or the broad industry because it adjusts for those business specific factors rather than assuming all semiconductor names deserve similar multiples. Comparing the Fair Ratio of 31.69x with the current P/E of 23.20x suggests the shares trade below that modelled level. On this metric, the stock appears to screen as undervalued.
Result: UNDERVALUED
P/E ratios tell one story, but what if the real opportunity lies elsewhere? Start investing in legacies, not executives. Discover our 22 top founder-led companies.
Upgrade Your Decision Making: Choose your Himax Technologies Narrative
Earlier we mentioned that there is an even better way to understand valuation. Let us introduce you to Narratives, which are simple stories you build around your own assumptions for Himax Technologies future revenue, earnings, margins and fair value, then track on Simply Wall St’s Community page where millions of investors share their views.
A Narrative links three pieces together: your view of the business, the forecast that view implies, and the fair value that results from those numbers. This helps you see clearly how your expectations translate into a price.
Because Narratives sit inside the platform, they stay easy to use and are updated automatically when new information such as news or earnings is added. This helps you quickly see whether your fair value still stacks up against the current market price.
With Himax, one investor might lean toward the higher fair value area around US$10.00 based on confidence in AR glasses, CPO and endpoint AI, while another might sit closer to the lower US$7.00 area if they focus more on risks in core display drivers and industry change. Narratives let you compare those viewpoints against today’s share price so you can decide what aligns with your own thesis.
For Himax Technologies, however, we'll make it really easy for you with previews of two leading Himax Technologies Narratives:
These give you a quick sense of how bullish and bearish analysts are connecting their assumptions on growth, margins and P/E multiples to a fair value, so you can decide which story sits closer to your own view.
🐂 Himax Technologies Bull Case
Fair value in this bullish narrative: US$10.00 per share
Implied pricing vs fair value: around 17.5% below this fair value at the recent US$8.25 share price
Assumed future revenue growth: 8.83% per year
- Upside case leans on Himax building on its role in CPO, AR glasses and WiseEye endpoint AI, with analysts assuming these areas support higher long term revenue and profit margins than current consensus.
- The narrative ties a fair value near US$10.00 to assumptions that revenue reaches about US$1.1b and earnings of US$151.2m by around 2028, with a future P/E of 6.08x on those earnings using a discount rate of 13.45%.
- Key risks that could break this bullish story include trade barriers, customer concentration, new display technologies that bypass Himax, and rising ESG and regulatory costs that pressure margins.
🐻 Himax Technologies Bear Case
Fair value in this bearish narrative: US$7.00 per share
Implied pricing vs fair value: around 17.9% above this fair value at the recent US$8.25 share price
Assumed future revenue growth: 7.39% per year
- The bear case argues that structural shifts from LCD to OLED and MicroLED, combined with pricing pressure and customer concentration, could cap Himax's long term growth and keep margins under strain.
- Here, analysts again use revenue of about US$1.1b and earnings of US$151.2m by 2028, but connect that to a lower future P/E of 11.37x and a fair value of US$7.00 using a 12.40% discount rate.
- This narrative could be challenged if automotive display wins, WiseEye AI solutions and optical products like co packaged optics and wafer level optics gain more traction than expected and support stronger, more resilient earnings.
Both narratives rely on different views of how enduring Himax's display and AI positions will be and what multiple the market might be willing to pay for those earnings. If you want to see the full reasoning behind each set of assumptions, you can step through them in detail with Curious how numbers become stories that shape markets? Explore Community Narratives and decide which story, if either, lines up with how you see Himax Technologies today.
Do you think there's more to the story for Himax Technologies? Head over to our Community to see what others are saying!

This article by Simply Wall St is general in nature. We provide commentary based on historical data and analyst forecasts only using an unbiased methodology and our articles are not intended to be financial advice. It does not constitute a recommendation to buy or sell any stock, and does not take account of your objectives, or your financial situation. We aim to bring you long-term focused analysis driven by fundamental data. Note that our analysis may not factor in the latest price-sensitive company announcements or qualitative material. Simply Wall St has no position in any stocks mentioned.
Have feedback on this article? Concerned about the content? Get in touch with us directly. Alternatively, email editorial-team@simplywallst.com