

Is Tennant (TNC) Offering A Potential Opportunity After Recent Share Price Weakness
- If you are looking at Tennant and wondering whether the current share price still offers value, you are not alone.
- The stock last closed at US$81.61, with returns of 1.0% over 7 days, 4.5% over 30 days, 10.3% year to date, and a 6.1% decline over the past year, which may have investors reassessing both its potential and its risks.
- Recent news coverage has focused on Tennant's position in the capital goods space and how investors are weighing its long term prospects against past share price performance. This context helps explain why some shareholders are rechecking whether the current valuation still lines up with their expectations.
- On our checklist based valuation model, Tennant scores a 6 out of 6 for undervaluation, which sets up a closer look at different valuation approaches next and hints at an even more helpful way to think about the company’s value that we will come back to at the end of the article.
Find out why Tennant's -6.1% return over the last year is lagging behind its peers.
Approach 1: Tennant Discounted Cash Flow (DCF) Analysis
A Discounted Cash Flow model takes estimates of a company’s future cash flows and discounts them back to today’s dollars, aiming to show what the entire business might be worth right now.
For Tennant, the model used is a 2 Stage Free Cash Flow to Equity approach, based on cash flow projections in US$. The latest twelve month free cash flow is about $65.47 million. Analyst estimates and subsequent extrapolations point to free cash flow reaching around $139 million in 2030, with intermediate projections between 2026 and 2035 ranging from roughly $112.40 million to $131.83 million before discounting.
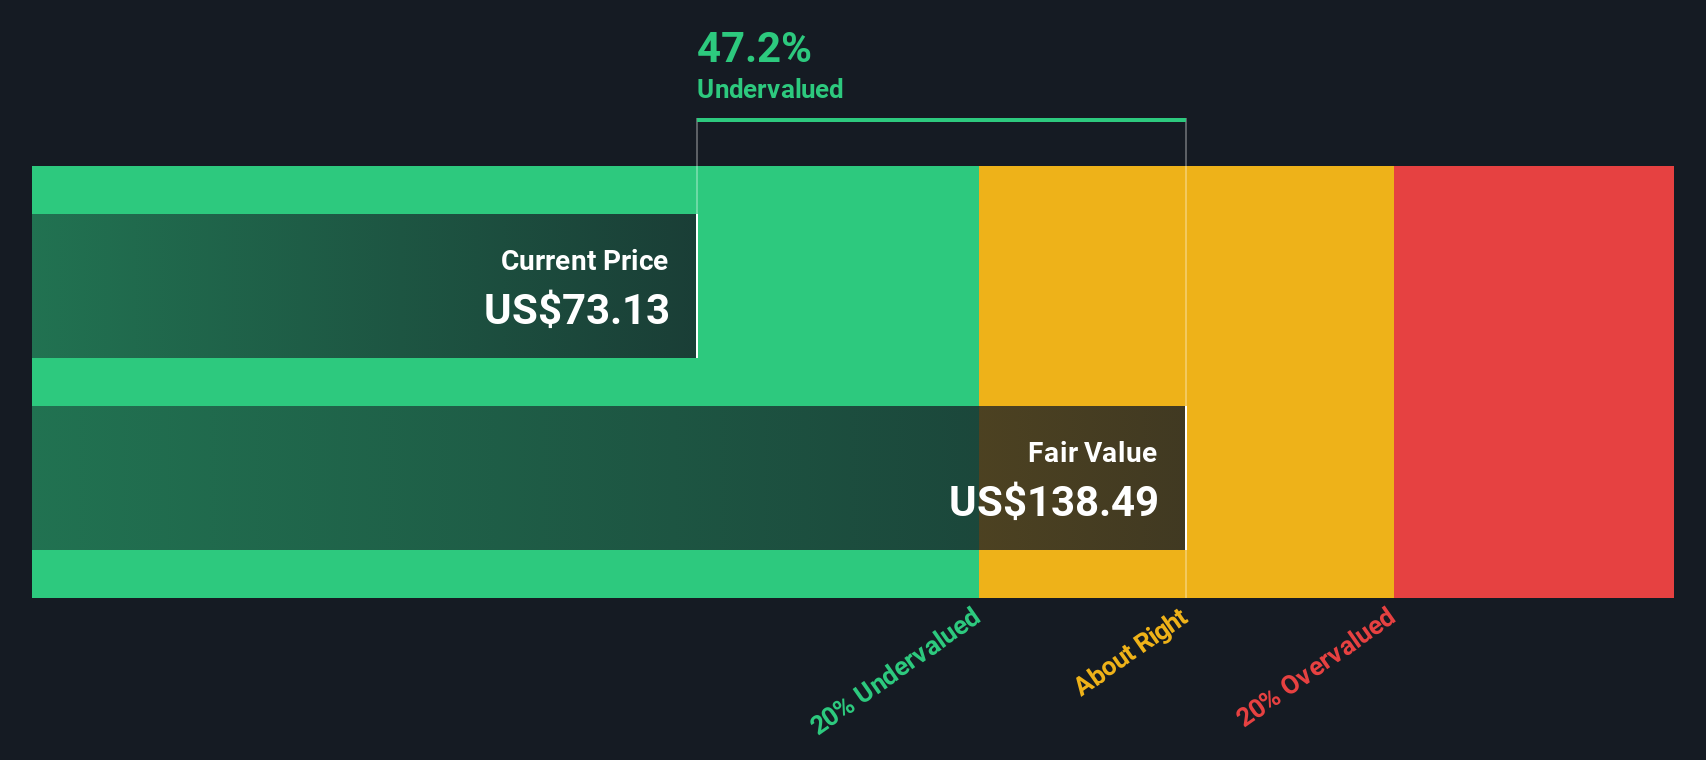
When all those projected cash flows are discounted back using this model, the estimated intrinsic value comes out at about $106.61 per share. Compared with the recent share price of $81.61, the model implies Tennant trades at roughly a 23.4% discount, which indicates the shares may be undervalued on this set of cash flow assumptions.
Result: UNDERVALUED
Our Discounted Cash Flow (DCF) analysis suggests Tennant is undervalued by 23.4%. Track this in your watchlist or portfolio, or discover 55 more high quality undervalued stocks.
Approach 2: Tennant Price vs Earnings
P/E is a common way to value profitable companies because it links what you pay directly to the earnings the company is already generating. In simple terms, a higher P/E often reflects higher market expectations for growth or a perception of lower risk, while a lower P/E can point to more modest growth expectations or higher perceived risk.
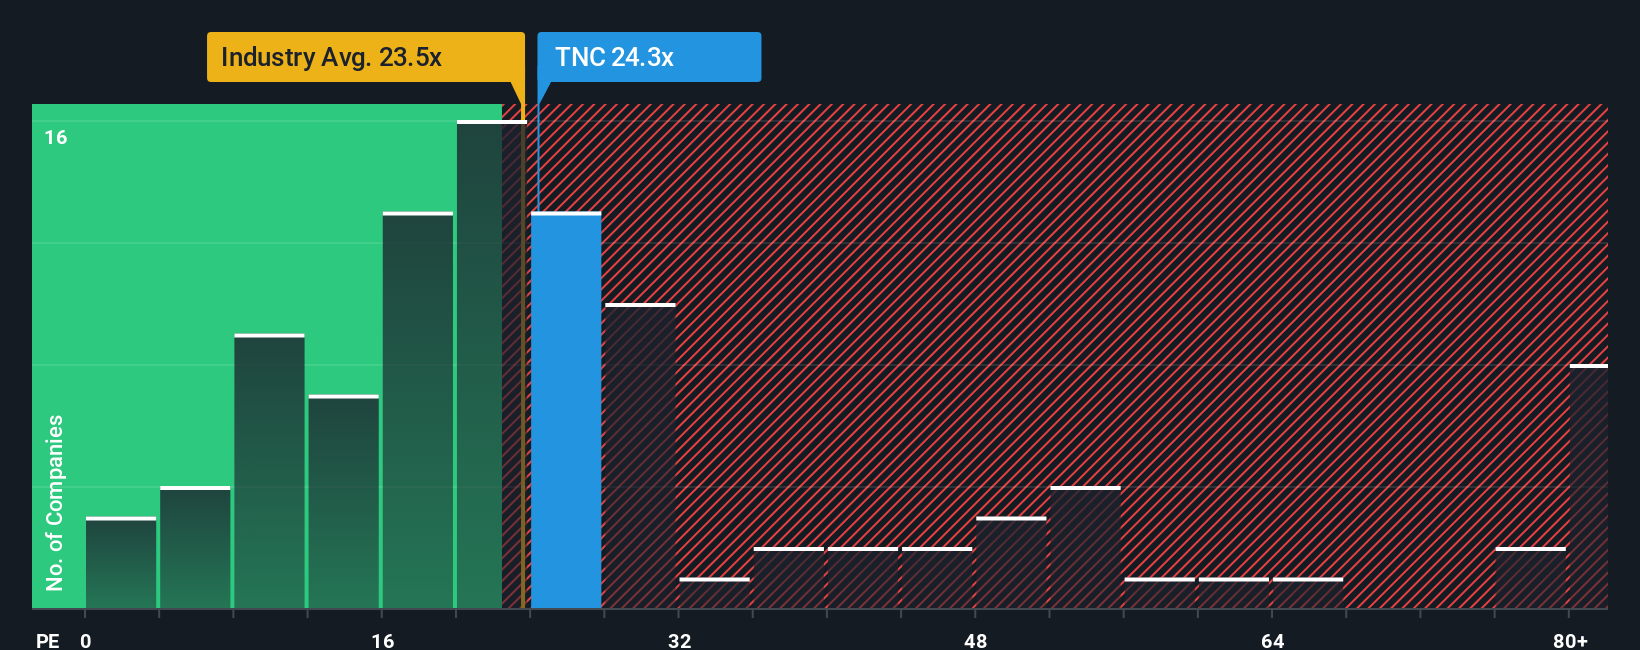
Tennant currently trades on a P/E of 26.99x. That sits below the Machinery industry average of 29.84x and well below the peer group average of 53.03x. On the surface, that suggests the market is pricing Tennant more cautiously than many of its listed peers.
Simply Wall St also calculates a Fair Ratio, which estimates what a more tailored P/E might be for Tennant based on factors like its earnings growth profile, profit margins, industry, market cap and specific risks. Because this Fair Ratio blends company specific and industry inputs, it can be more informative than a simple comparison with broad industry or peer averages. For Tennant, the Fair Ratio is 31.38x, above the current 26.99x P/E. This points to the shares looking inexpensive on this metric.
Result: UNDERVALUED
P/E ratios tell one story, but what if the real opportunity lies elsewhere? Start investing in legacies, not executives. Discover our 23 top founder-led companies.
Upgrade Your Decision Making: Choose your Tennant Narrative
Earlier we mentioned that there is an even better way to understand valuation. Let us introduce Narratives, which simply means you attach your own story about Tennant to the numbers you think are reasonable for its future revenue, earnings, margins and fair value. You then link that story to a forecast and compare your Fair Value against the current share price to help decide whether the stock looks attractive. Use the Narratives tool on Simply Wall St’s Community page, where millions of investors share these stories, and see in real time how they update when new earnings or news arrives. For example, one Tennant Narrative currently argues for a Fair Value of US$125, while a more cautious one sits at US$93. Your job is to decide which story makes more sense to you, or to sketch your own version in between.
Do you think there's more to the story for Tennant? Head over to our Community to see what others are saying!

This article by Simply Wall St is general in nature. We provide commentary based on historical data and analyst forecasts only using an unbiased methodology and our articles are not intended to be financial advice. It does not constitute a recommendation to buy or sell any stock, and does not take account of your objectives, or your financial situation. We aim to bring you long-term focused analysis driven by fundamental data. Note that our analysis may not factor in the latest price-sensitive company announcements or qualitative material. Simply Wall St has no position in any stocks mentioned.
Have feedback on this article? Concerned about the content? Get in touch with us directly. Alternatively, email editorial-team@simplywallst.com