

Is It Too Late To Consider Amphenol (APH) After The CommScope CCS Acquisition Deal?
- If you are wondering whether Amphenol is priced attractively after its strong run, this article walks through what the latest numbers may be saying about the stock's value.
- The share price last closed at US$143.73, with returns of 12.6% over 7 days, a 3.5% decline over 30 days, 2.9% year to date and 108.8% over 1 year, plus a very large 3 year and 5 year return. All of these figures can feed into how investors think about upside and risk today.
- Recent company news has continued to focus attention on Amphenol's role in the broader technology and connectivity space, which helps explain why the stock's performance has stayed on many investors' radar. These headlines give useful context for assessing whether the current price still lines up with what the underlying business may be worth.
- On Simply Wall St's valuation checks, Amphenol scores 2 out of 6, which you can see in full at this valuation score. Next we will break down the main valuation approaches that feed into that figure, before finishing with a way to think about value that goes beyond any single model.
Amphenol scores just 2/6 on our valuation checks. See what other red flags we found in the full valuation breakdown.
Approach 1: Amphenol Discounted Cash Flow (DCF) Analysis
A Discounted Cash Flow, or DCF, model takes estimates of the cash a company may generate in the future, then discounts those cash flows back to today to arrive at an implied value per share.
For Amphenol, the model used is a 2 Stage Free Cash Flow to Equity approach. The latest twelve month free cash flow is about $4.45b. Analysts have provided cash flow projections for the next several years, and Simply Wall St extends these estimates further, including an expected free cash flow of $9.83b in 2030. The ten year path between today and 2035 is based on a mix of analyst inputs and extrapolated figures in US$.
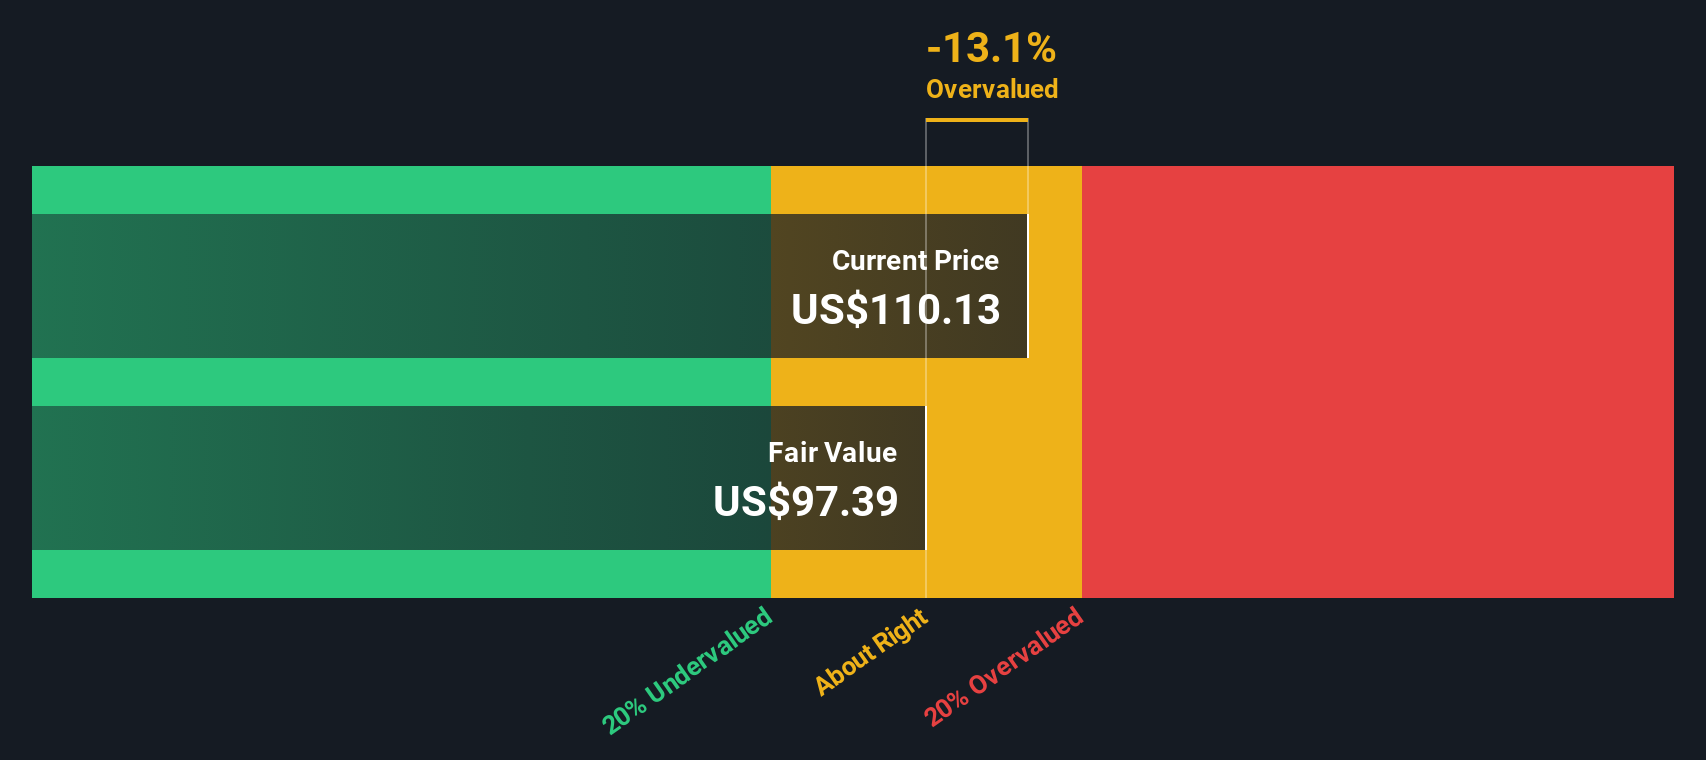
When all those projected cash flows are discounted back to today, the model arrives at an estimated intrinsic value of about $147.77 per share. Compared with the recent share price of $143.73, this implies the stock is around 2.7% undervalued, which sits well within a normal margin of error for this type of model.
Result: ABOUT RIGHT
Amphenol is fairly valued according to our Discounted Cash Flow (DCF), but this can change at a moment's notice. Track the value in your watchlist or portfolio and be alerted on when to act.
Approach 2: Amphenol Price vs Earnings
For a profitable business like Amphenol, the P/E ratio is a useful way to think about value because it links what you are paying directly to the earnings the company is generating today. Investors usually accept a higher P/E when they expect stronger growth or see lower risk, and a lower P/E when they expect slower growth or higher risk, so there is no single “right” number that fits every company.
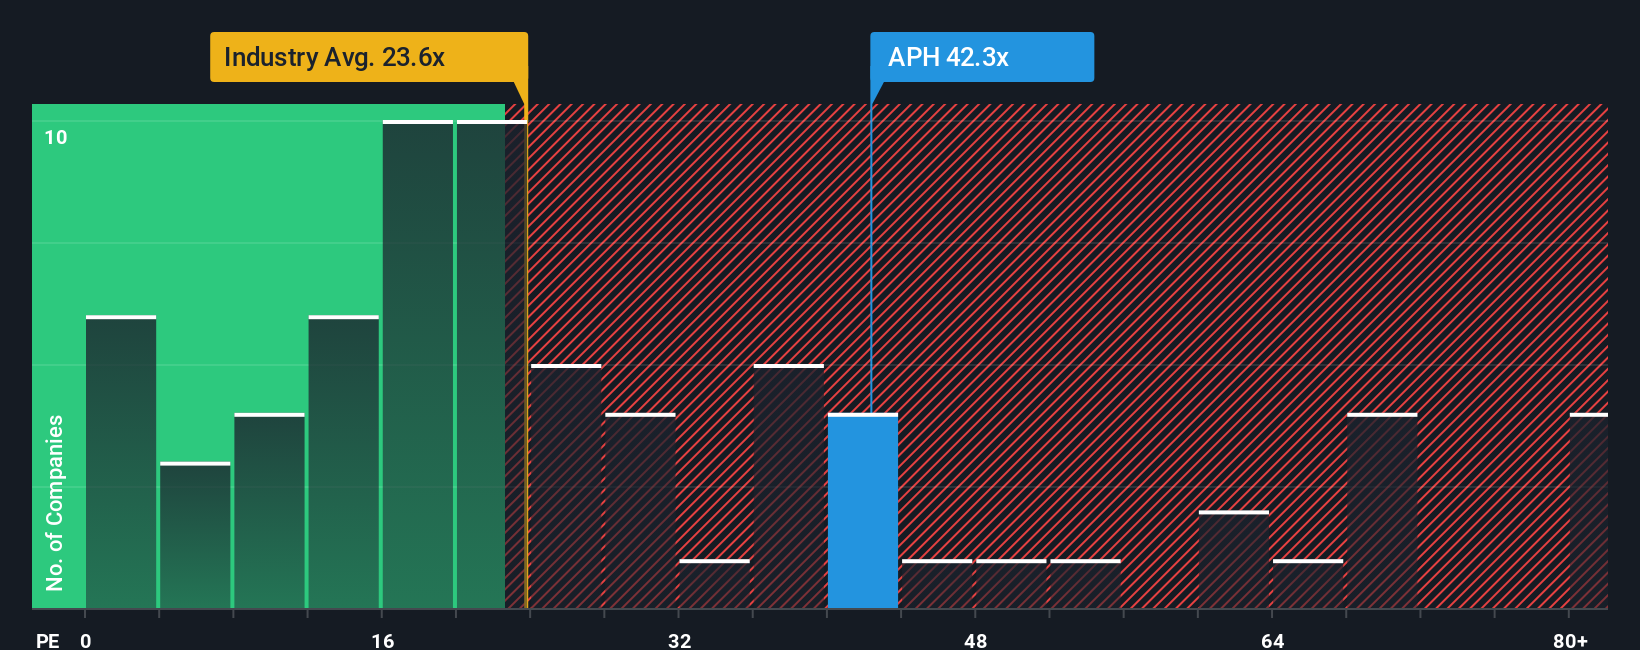
Amphenol currently trades on a P/E of 41.37x. That sits above the Electronic industry average P/E of 27.07x and below the peer average of 46.94x, so the stock is priced at a premium to the broader industry but not at the top of its peer group. Simply Wall St also calculates a “Fair Ratio” of 36.01x for Amphenol, which is the P/E level its model suggests after considering factors like earnings growth, profit margins, industry, market cap and company specific risks.
This Fair Ratio can be more useful than a simple industry or peer comparison because it adjusts for Amphenol’s own fundamentals rather than assuming all companies deserve similar multiples. With the current P/E of 41.37x above the Fair Ratio of 36.01x, the shares appear slightly expensive on this metric.
Result: OVERVALUED
P/E ratios tell one story, but what if the real opportunity lies elsewhere? Start investing in legacies, not executives. Discover our 23 top founder-led companies.
Upgrade Your Decision Making: Choose your Amphenol Narrative
Earlier we mentioned that there is an even better way to understand valuation. On Simply Wall St you can use Narratives, where you set a story for Amphenol, link that story to specific forecasts for revenue, earnings and margins, and end up with your own Fair Value that you can compare to the current price in real time. The platform automatically updates your Narrative when new earnings or news arrives. For example, one investor might build a bullish Amphenol Narrative around a higher fair value of about US$205 per share tied to stronger growth assumptions, while another might build a more cautious Narrative closer to US$124 per share. The gap between those two fair values simply reflects different, clearly stated views that you can see, test, and adjust for yourself inside the Community page used by millions of other investors.
For Amphenol however we'll make it really easy for you with previews of two leading Amphenol Narratives:
Fair value in this bullish Narrative: about US$205.24 per share
Implied discount to that fair value versus the last close of US$143.73: roughly 30% undervalued using ((205.24 minus 143.73) divided by 205.24)
Revenue growth assumption in this Narrative: about 21.30% a year
- Backers of this view focus on Amphenol's role in next generation infrastructure and AI related content gains, along with the planned CommScope Connectivity and Cable Solutions deal, as key supports for stronger revenue and earnings.
- They lean on higher margin assumptions and robust free cash flow, with the CCS acquisition and other deals expected to scale the business and support a higher long term P/E multiple than the broader US Electronic industry.
- This camp is comfortable using higher revenue, margin, and future P/E inputs, which results in a fair value that sits well above the most bullish published analyst target of US$134.00 in the source Narrative.
Fair value in this cautious Narrative: about US$123.77 per share
Implied premium to that fair value versus the last close of US$143.73: roughly 16% overvalued using ((143.73 minus 123.77) divided by 123.77)
Revenue growth assumption in this Narrative: about 20.29% a year
- Analysts using this frame point to risks from wireless and contactless technologies, supply chain shifts, regulation, and price competition that could weigh on margins, pricing power, and long term free cash flow.
- They still build in solid revenue and margin progression, but pair that with a lower future P/E multiple of about 26.10x, reflecting concern that the market may not keep paying as rich a valuation if growth or returns come in below current hopes.
- This view also highlights integration and execution risk around the CommScope Connectivity and Cable Solutions acquisition, along with the possibility that sector wide demand or AI related content gains could undershoot what some models assume.
Taken together, these Narratives bracket a wide fair value range, from about US$124 to roughly US$205 per share, built on different but clearly laid out assumptions. Your job is to decide which set of numbers feels closer to how you see Amphenol's future, or to build your own view that sits somewhere in between.
Curious how numbers become stories that shape markets? Explore Community Narratives
Do you think there's more to the story for Amphenol? Head over to our Community to see what others are saying!

This article by Simply Wall St is general in nature. We provide commentary based on historical data and analyst forecasts only using an unbiased methodology and our articles are not intended to be financial advice. It does not constitute a recommendation to buy or sell any stock, and does not take account of your objectives, or your financial situation. We aim to bring you long-term focused analysis driven by fundamental data. Note that our analysis may not factor in the latest price-sensitive company announcements or qualitative material. Simply Wall St has no position in any stocks mentioned.
Have feedback on this article? Concerned about the content? Get in touch with us directly. Alternatively, email editorial-team@simplywallst.com