


- If you are wondering whether American Superconductor’s share price still makes sense at current levels, this article walks through what the numbers say about value rather than hype.
- The stock recently closed at US$34.26, with returns of 21.6% over 7 days, 9.6% over 30 days, 8.5% year to date, 9.9% over 1 year and a very large gain over 3 years, with a 5 year return of 31.9%.
- These moves have put American Superconductor back on many investors’ watchlists, as they reassess whether the current price still reflects the company’s prospects or if expectations have already shifted. This article was created as evergreen coverage, so the aim is to give you a standing reference point on how the stock is priced rather than reacting to any single short term headline.
- On our valuation checklist, American Superconductor scores 3 out of 6 for being undervalued. Next, we will look at what different valuation methods suggest about the price today, before finishing with a framework you can use to judge valuation more effectively for yourself.
Find out why American Superconductor's 9.9% return over the last year is lagging behind its peers.
Approach 1: American Superconductor Discounted Cash Flow (DCF) Analysis
A Discounted Cash Flow, or DCF, model estimates what a company might be worth by projecting future cash flows and discounting them back to today using a required rate of return. It is essentially asking what those future dollars are worth in today’s terms.
For American Superconductor, the model used is a 2 Stage Free Cash Flow to Equity approach based on cash flow projections. The company’s latest twelve month free cash flow is about $17.09 million. Analyst inputs run through 2030, and Simply Wall St extrapolates further out to 2035, with projected free cash flow in 2035 of $73.61 million, all in US$ terms. Each of these future cash flows is discounted back to the present to reflect risk and the time value of money.
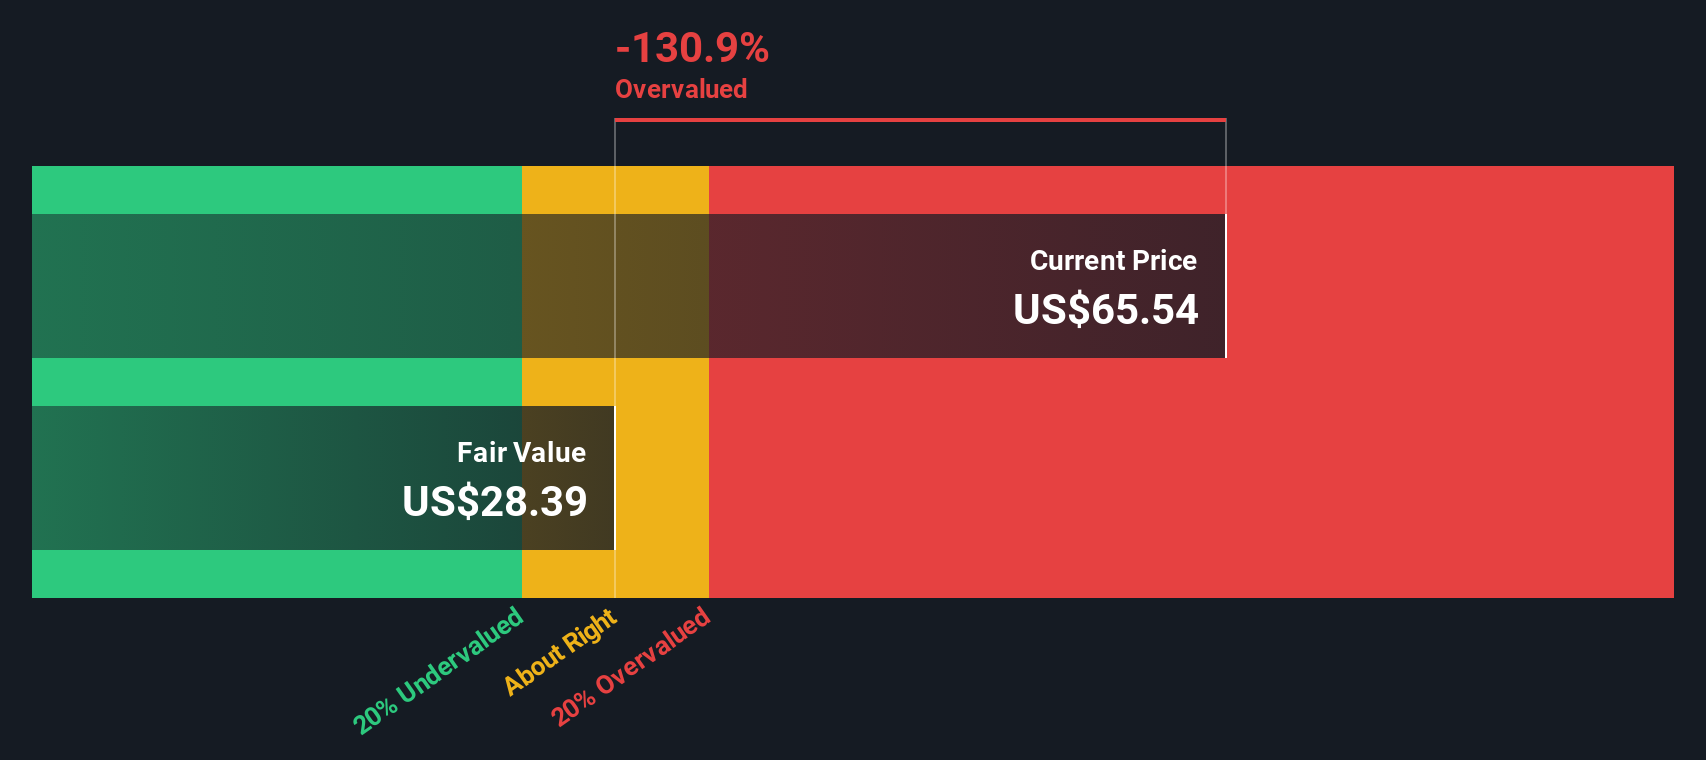
Putting those projections together, the DCF model arrives at an estimated intrinsic value of about $16.26 per share. Compared with the recent share price of $34.26, the model implies the stock is around 110.7% overvalued based on these assumptions and inputs.
Result: OVERVALUED
Our Discounted Cash Flow (DCF) analysis suggests American Superconductor may be overvalued by 110.7%. Discover 53 high quality undervalued stocks or create your own screener to find better value opportunities.
Approach 2: American Superconductor Price vs Earnings
For a company that is generating earnings, the P/E ratio is a useful way to gauge what investors are currently willing to pay for each dollar of profit. It captures both what the business is earning today and how the market feels about its prospects and risks.
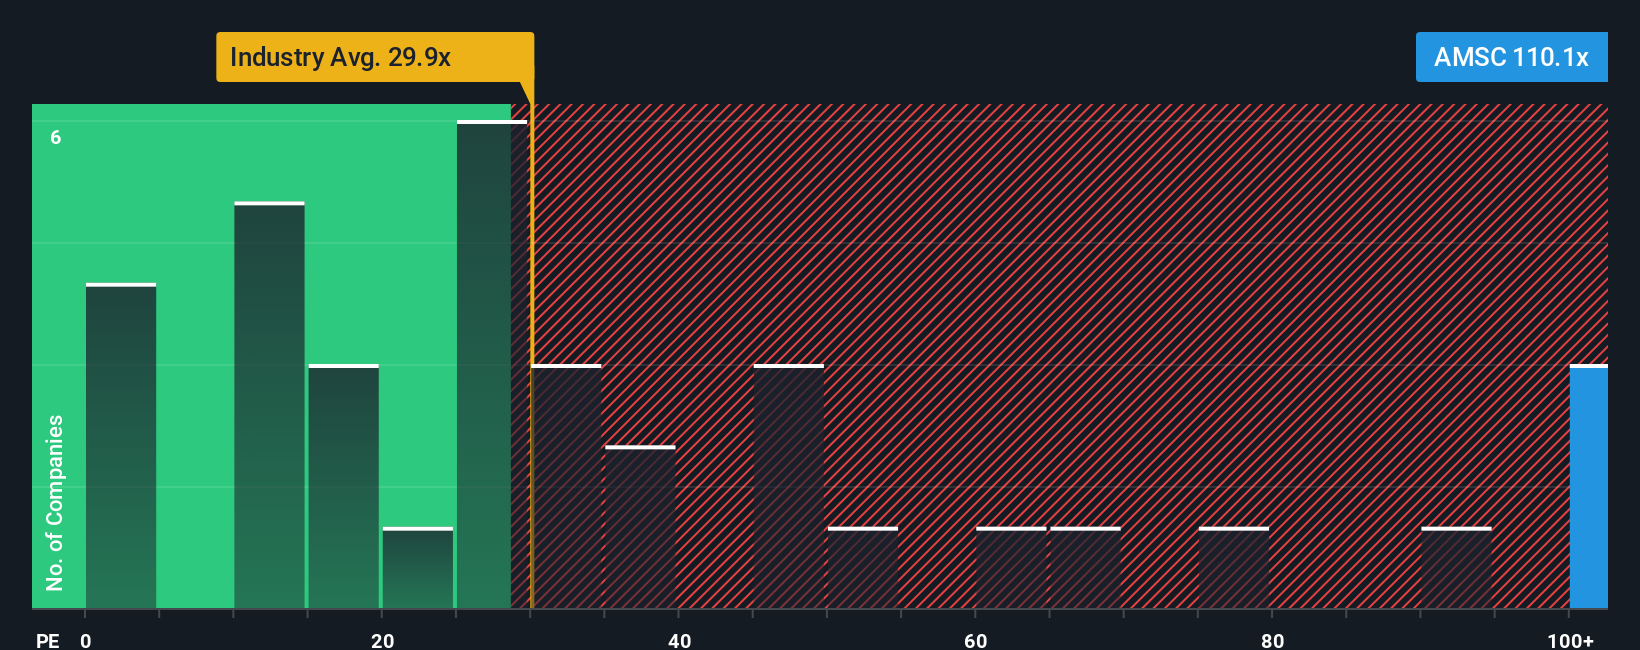
Higher expected growth or lower perceived risk can justify a higher P/E, while lower growth expectations or higher risk usually call for a lower, more cautious multiple. American Superconductor currently trades on a P/E of about 12.50x. That is well below the Electrical industry average of roughly 35.62x and also below the broader peer group average of about 44.40x.
Simply Wall St’s Fair Ratio of 18.06x is a proprietary estimate of what P/E might be reasonable, after accounting for factors such as earnings growth, profit margins, risk profile, industry and market cap. This tends to be more tailored than a simple comparison with peers or the sector, which can be skewed by outliers or companies at very different stages. With American Superconductor on 12.50x compared with a Fair Ratio of 18.06x, the stock appears to be trading below that tailored benchmark on this measure.
Result: UNDERVALUED
P/E ratios tell one story, but what if the real opportunity lies elsewhere? Start investing in legacies, not executives. Discover our 23 top founder-led companies.
Upgrade Your Decision Making: Choose your American Superconductor Narrative
Earlier we mentioned that there is an even better way to understand valuation. Narratives on Simply Wall St let you set out your story for American Superconductor, link that story to your own revenue, earnings and margin assumptions, convert those into a fair value, then compare that fair value to the current price. The system updates your view as new news or earnings arrive. This means one investor might lean toward the lower US$49 fair value case that assumes revenue of US$461.6 million, earnings of US$56.4 million and a P/E of 66.0x by 2029. Another might prefer the higher US$61 fair value case tied to assumptions like revenue of US$361.8 million, earnings of US$43.2 million and a P/E of 67.31x by 2028. All of these are shared and discoverable in the Community page used by millions of investors.
Do you think there's more to the story for American Superconductor? Head over to our Community to see what others are saying!

This article by Simply Wall St is general in nature. We provide commentary based on historical data and analyst forecasts only using an unbiased methodology and our articles are not intended to be financial advice. It does not constitute a recommendation to buy or sell any stock, and does not take account of your objectives, or your financial situation. We aim to bring you long-term focused analysis driven by fundamental data. Note that our analysis may not factor in the latest price-sensitive company announcements or qualitative material. Simply Wall St has no position in any stocks mentioned.
Have feedback on this article? Concerned about the content? Get in touch with us directly. Alternatively, email editorial-team@simplywallst.com