

Is Globus Medical (GMED) Pricing Look Attractive After Recent Sideways Share Performance
- If you are wondering whether Globus Medical at around US$88.09 is offering good value today, you are not alone in asking whether the current price properly reflects the business.
- The share price has been fairly steady over the past week with a 0.3% return, sits slightly lower over the last month with a 4.7% decline, and is up 0.9% year to date, while the 1 year and 3 year returns of 5.0% and 46.4% give longer term holders a different perspective on risk and reward.
- Recent coverage has focused on Globus Medical's position in the medical devices space and how market sentiment has shifted around the sector, with investors weighing long term demand expectations against shorter term share price moves. This context helps explain why the stock has seen a mix of modest recent returns and stronger multi year performance as views on risk and opportunity have evolved.
- Our valuation checks currently give Globus Medical a value score of 5 out of 6, which suggests there is more to unpack across different valuation methods. We will also discuss a way to look beyond the usual metrics toward the end of this article.
Approach 1: Globus Medical Discounted Cash Flow (DCF) Analysis
A Discounted Cash Flow model estimates what a company might be worth by projecting its future cash flows and then discounting those back to today using a required rate of return. It is essentially asking what those future dollars are worth in today's terms.
For Globus Medical, the latest twelve month Free Cash Flow is about $573.8 million. The model used here is a 2 Stage Free Cash Flow to Equity approach, which combines analyst estimates and longer range projections. Analyst inputs run out after a few years, so Simply Wall St extrapolates further cash flows, including a projected Free Cash Flow of $939.8 million in 2035.
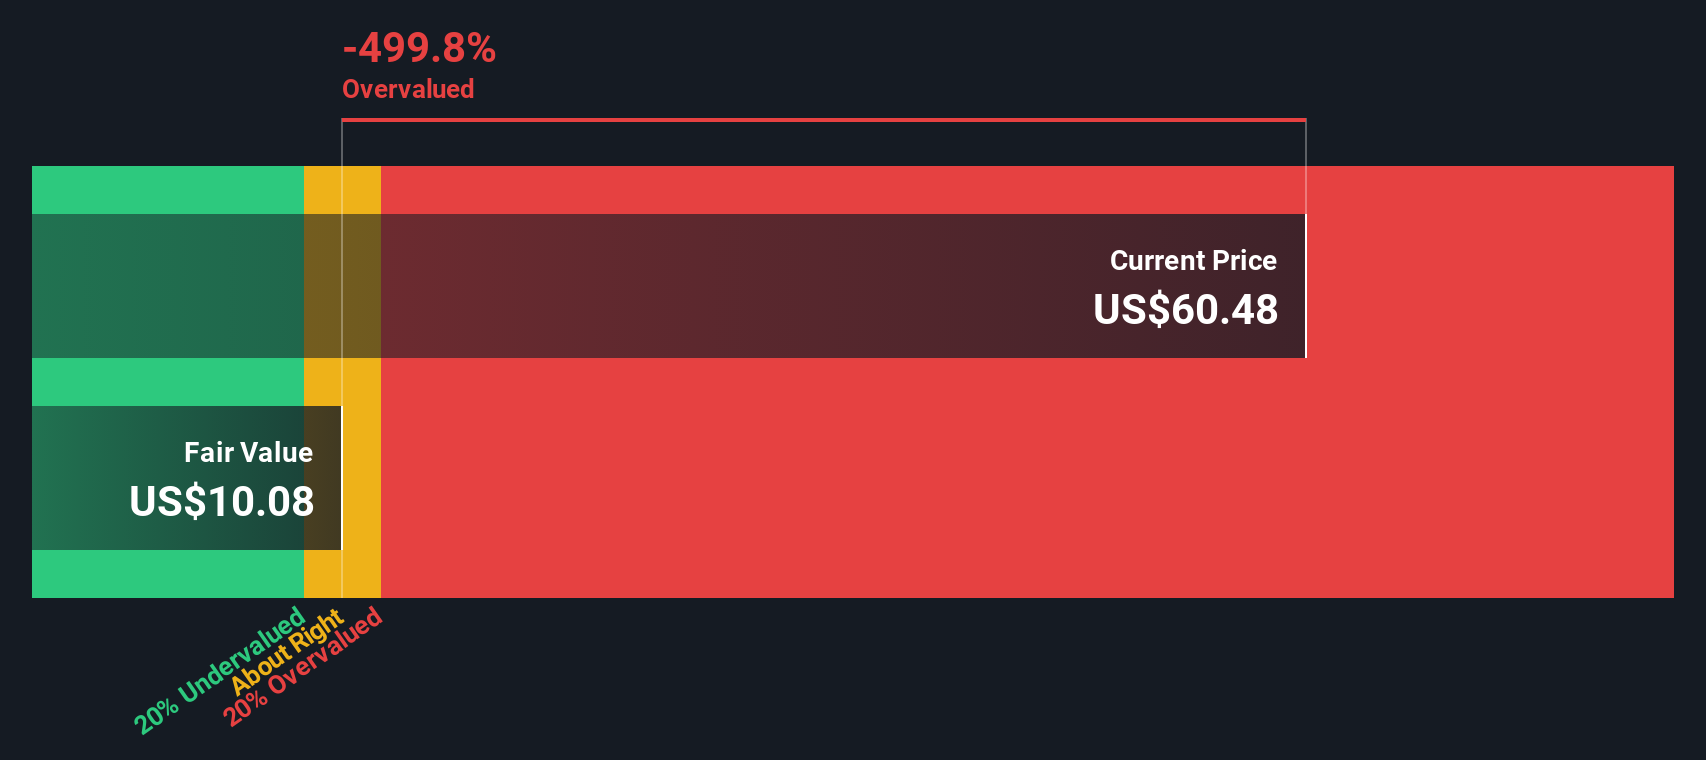
When those projected cash flows are discounted back and summed, the model arrives at an estimated intrinsic value of $118.77 per share. Compared with the recent share price of about $88.09, this implies the stock is around 25.8% undervalued based on these assumptions and inputs.
Result: UNDERVALUED
Our Discounted Cash Flow (DCF) analysis suggests Globus Medical is undervalued by 25.8%. Track this in your watchlist or portfolio, or discover 53 more high quality undervalued stocks.
Approach 2: Globus Medical Price vs Earnings
For a profitable company like Globus Medical, the P/E ratio is a useful way to relate what you pay for the stock to the earnings it currently generates. Investors usually accept a higher P/E when they expect stronger growth or see lower risk, and a lower P/E when growth expectations are more modest or risks feel higher.
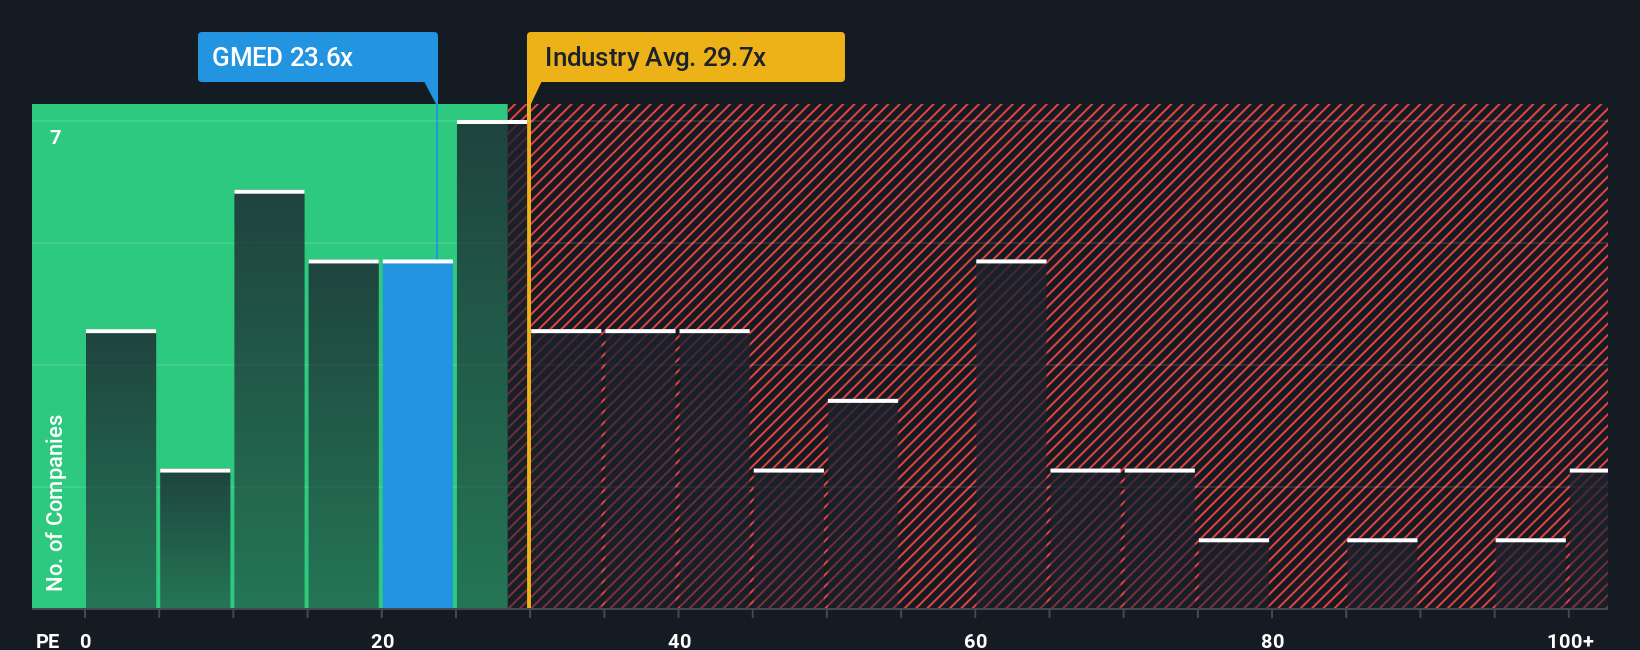
Globus Medical is trading on a P/E of 27.82x. That sits below the Medical Equipment industry average P/E of 29.71x and well below the peer group average of 52.07x. This indicates the market is pricing Globus Medical more cautiously than many peers in the same space.
Simply Wall St's Fair Ratio for Globus Medical is 23.99x. This is its proprietary estimate of what the P/E might be based on factors such as earnings growth, profit margins, industry, market cap and risk profile. This can be more tailored than a simple comparison with peers or the broad industry, because it attempts to adjust for company specific characteristics rather than treating all businesses as equal.
With the current P/E of 27.82x sitting above the Fair Ratio of 23.99x, the multiple based view points to the shares being on the expensive side.
Result: OVERVALUED
P/E ratios tell one story, but what if the real opportunity lies elsewhere? Start investing in legacies, not executives. Discover our 23 top founder-led companies.
Upgrade Your Decision Making: Choose your Globus Medical Narrative
Earlier we mentioned that there is an even better way to understand valuation, so let us introduce you to Narratives, which simply means writing the story you believe about Globus Medical and tying that story to numbers like future revenue, earnings, margins and a fair value estimate. On Simply Wall St’s Community page, Narratives give you a framework to connect a company’s business context to a forecast and then to a fair value, so you can compare that fair value with the current price and decide whether the stock looks attractive or not based on your own expectations. These Narratives are easy to use, sit alongside the usual metrics, and update automatically when new information such as results or news headlines is added to the platform, so your view does not stay frozen in time. For Globus Medical, one investor might anchor on a more cautious fair value around US$65.0 while another sees a higher potential value closer to US$106.0. Narratives help you see exactly which revenue growth, margin and P/E assumptions sit behind each of those views so you can judge which story feels closer to your own.
Do you think there's more to the story for Globus Medical? Head over to our Community to see what others are saying!

This article by Simply Wall St is general in nature. We provide commentary based on historical data and analyst forecasts only using an unbiased methodology and our articles are not intended to be financial advice. It does not constitute a recommendation to buy or sell any stock, and does not take account of your objectives, or your financial situation. We aim to bring you long-term focused analysis driven by fundamental data. Note that our analysis may not factor in the latest price-sensitive company announcements or qualitative material. Simply Wall St has no position in any stocks mentioned.
Have feedback on this article? Concerned about the content? Get in touch with us directly. Alternatively, email editorial-team@simplywallst.com