

Is Textron (TXT) Fairly Priced After A 36% One Year Share Price Gain?
- If you are wondering whether Textron's current share price reflects its real worth, you are not alone. Many investors are asking the same question right now.
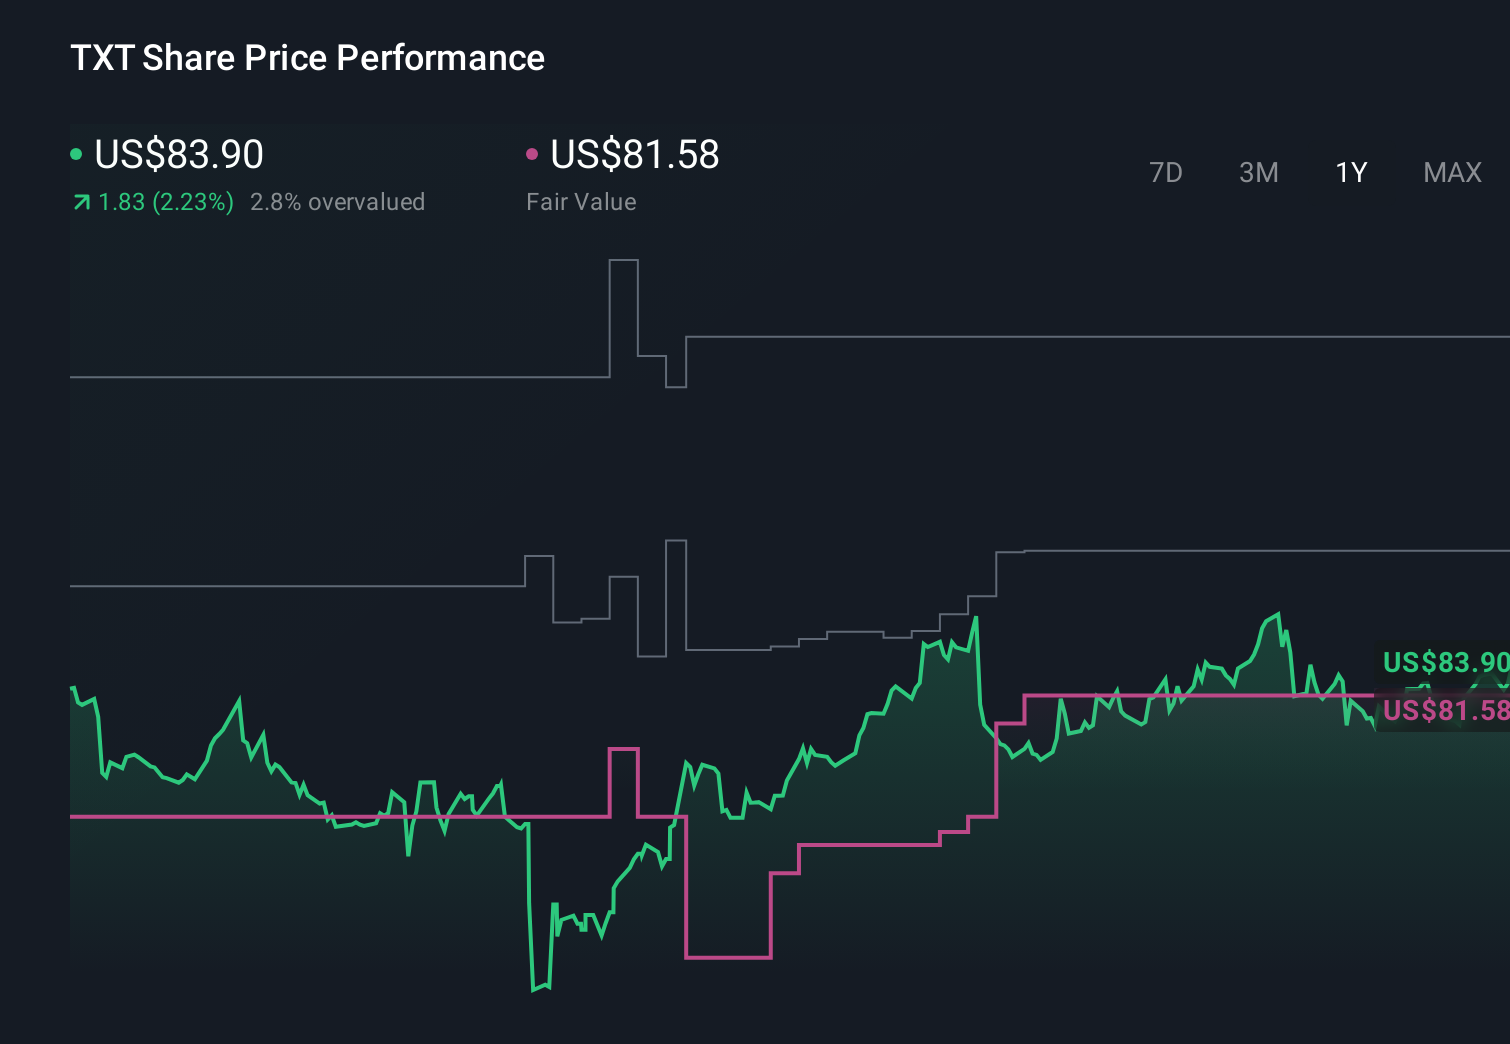
- Textron's stock last closed at US$98.09, with returns of 2.8% over 7 days, 4.2% over 30 days, 12.7% year to date, 35.8% over 1 year and 94.1% over 5 years. This naturally raises questions about how much of this performance is already priced in.
- Recent attention has focused on Textron's role in capital goods and aerospace related markets, with investors watching how its mix of businesses positions it within its sector. This context is important when considering whether the current share price lines up with the fundamentals behind those businesses.
- On our checks, Textron scores 3/6 on valuation, indicating it screens as undervalued on half of the measures used. You can see the breakdown of that valuation score here. Next we will walk through the main valuation approaches behind that number and finish with a broader way to think about what valuation really means for your own portfolio.
Find out why Textron's 35.8% return over the last year is lagging behind its peers.
Approach 1: Textron Discounted Cash Flow (DCF) Analysis
A Discounted Cash Flow, or DCF, model estimates what a business might be worth today by projecting its future cash flows and discounting them back to a present value. It is essentially asking what future cash Textron could generate for shareholders and what that stream is worth in today's dollars.
Textron's latest twelve month Free Cash Flow is about $909.2 million. The DCF used here is a 2 Stage Free Cash Flow to Equity model, which first uses analyst projections and then extends those estimates further out. For example, Simply Wall St includes projections such as $700.0 million in 2026 and $1,061.0 million in 2029, with later years extrapolated rather than directly forecast by analysts.
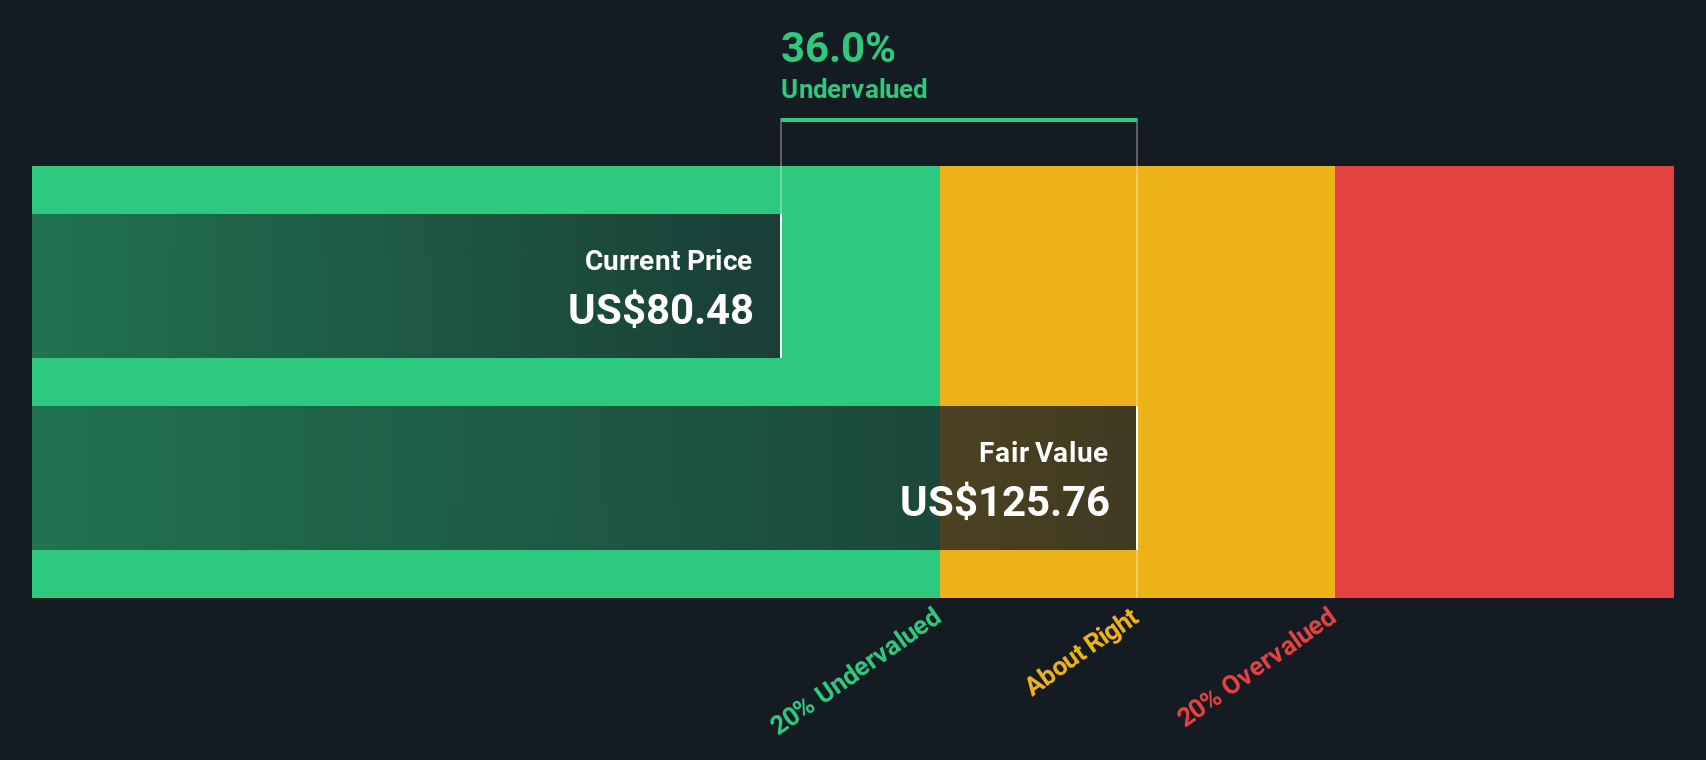
On this basis, the model arrives at an estimated intrinsic value of about $94.09 per share. Compared with the recent share price of US$98.09, the DCF suggests Textron is around 4.3% overvalued, which is a relatively small gap and within a range where the stock can be considered close to fair value.
Result: ABOUT RIGHT
Textron is fairly valued according to our Discounted Cash Flow (DCF), but this can change at a moment's notice. Track the value in your watchlist or portfolio and be alerted on when to act.
Approach 2: Textron Price vs Earnings
For a profitable business like Textron, the P/E ratio is a useful way to gauge how much you are paying for each dollar of earnings. It ties the share price directly to the company’s current earnings power, which is usually the starting point for many investors.
What counts as a “normal” P/E depends on how the market views a company’s growth potential and risk. Higher expected growth or lower perceived risk can justify a higher P/E, while slower growth or higher risk usually points to a lower multiple.
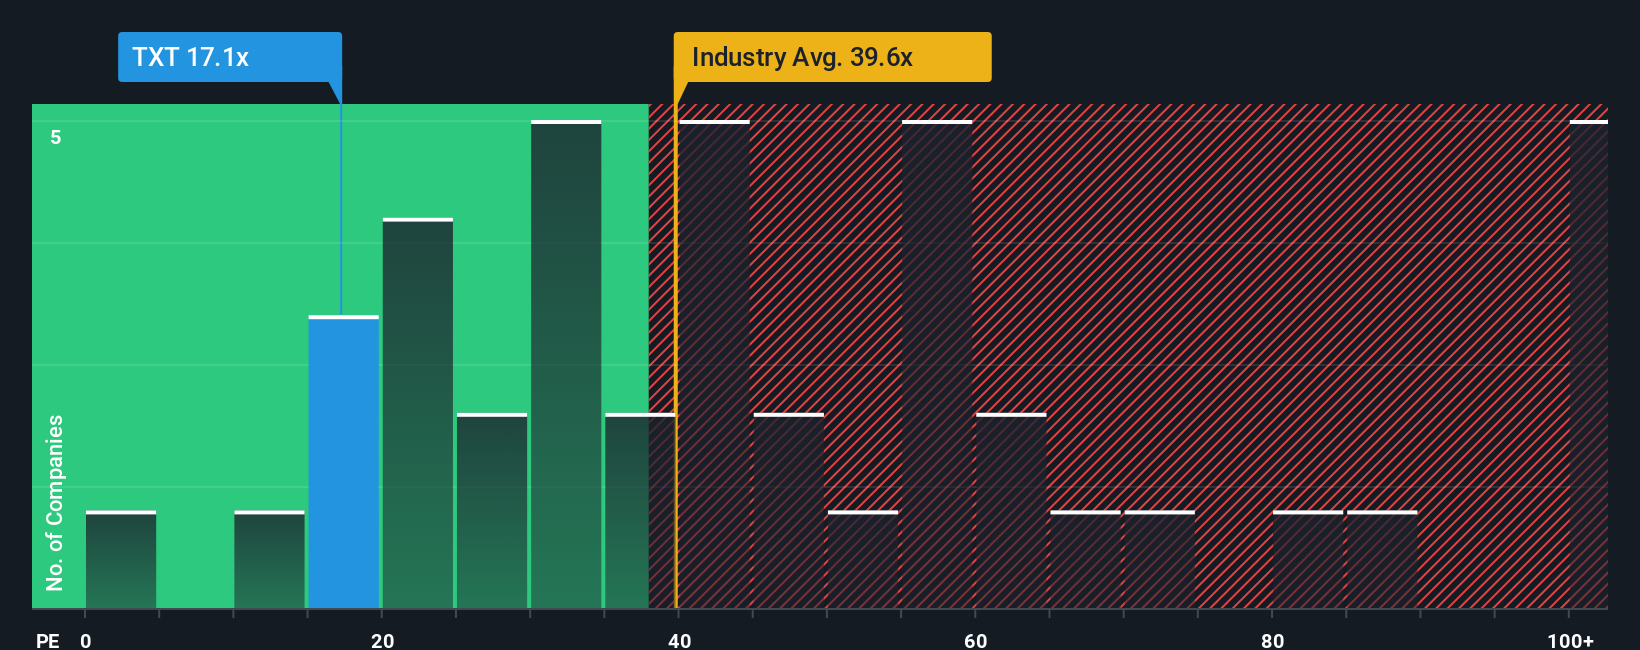
Textron currently trades on a P/E of about 18.5x, compared with an Aerospace & Defense industry average of roughly 40.7x and a peer average of about 44.7x. Simply Wall St’s Fair Ratio for Textron is 25.1x, which is its view of a suitable P/E given factors such as earnings growth, industry, profit margins, market cap and risk profile. This Fair Ratio can be more informative than a straight industry or peer comparison because it is tailored to Textron’s own characteristics rather than broad group averages. With the current P/E at 18.5x versus a Fair Ratio of 25.1x, Textron screens as undervalued on this measure.
Result: UNDERVALUED
P/E ratios tell one story, but what if the real opportunity lies elsewhere? Start investing in legacies, not executives. Discover our 23 top founder-led companies.
Upgrade Your Decision Making: Choose your Textron Narrative
Earlier we mentioned that there is an even better way to understand valuation. Let us introduce you to Narratives. Narratives let you connect your view of Textron's story with a set of financial assumptions and a fair value estimate. All of this is available in a simple tool on Simply Wall St's Community page that compares that fair value with the current price, updates automatically as news or earnings arrive, and shows how different investors can reasonably land anywhere from about US$73 on the cautious side to about US$103 on the optimistic side, even when they are all looking at the same company.
For Textron, we will make it really easy for you with previews of two leading Textron narratives:
Fair value in this bull case narrative: US$98.41 per share
Current price vs this fair value: about 0.3% below the narrative fair value
Revenue growth used in this narrative: 4.3% a year
- Analysts in this camp consider programs such as the GE Catalyst engine for Beechcraft Denali, Bell contracts and the Industrial reshuffle as potential supports for revenue and profit margin improvement over time.
- The blended fair value is tied to assumptions for revenue of about US$16.2b, earnings of roughly US$1.1b and a future P/E in the mid teens, with an 8.0% discount rate applied to bring those numbers back to today.
- Risks focus on cost control, product mix in Aviation, exposure to auto markets and potential tariff or geopolitical shocks, which could all put pressure on margins if they do not develop in Textron's favor.
Fair value in this bear case narrative: US$89.00 per share
Current price vs this fair value: about 10.2% above the narrative fair value
Revenue growth used in this narrative: 2.6% a year
- The bearish cohort highlights softer Industrial volumes, pressure on Textron Aviation margins and tariff or trade uncertainty as reasons to anticipate only modest revenue growth and slower profit expansion.
- This view anchors on a fair value of US$89, with revenue assumptions closer to US$14.7b, earnings around US$1.1b and a lower future P/E in the low teens when discounted at just under 8.0%.
- Even in this cautious setup, the backlog at Aviation and Bell, aftermarket activity and work on projects such as FLRAA and hybrid electric VTOL are cited as important supports that could make this case appear conservative if they perform more favorably than these assumptions.
Do you think there's more to the story for Textron? Head over to our Community to see what others are saying!
This article by Simply Wall St is general in nature. We provide commentary based on historical data and analyst forecasts only using an unbiased methodology and our articles are not intended to be financial advice. It does not constitute a recommendation to buy or sell any stock, and does not take account of your objectives, or your financial situation. We aim to bring you long-term focused analysis driven by fundamental data. Note that our analysis may not factor in the latest price-sensitive company announcements or qualitative material. Simply Wall St has no position in any stocks mentioned.
Have feedback on this article? Concerned about the content? Get in touch with us directly. Alternatively, email editorial-team@simplywallst.com