

Is It Too Late To Consider XPO (XPO) After Its Recent 30% Surge?
- If you are wondering whether XPO is still offering fair value after its recent run, you are not alone. This article will help you frame that question clearly before you act.
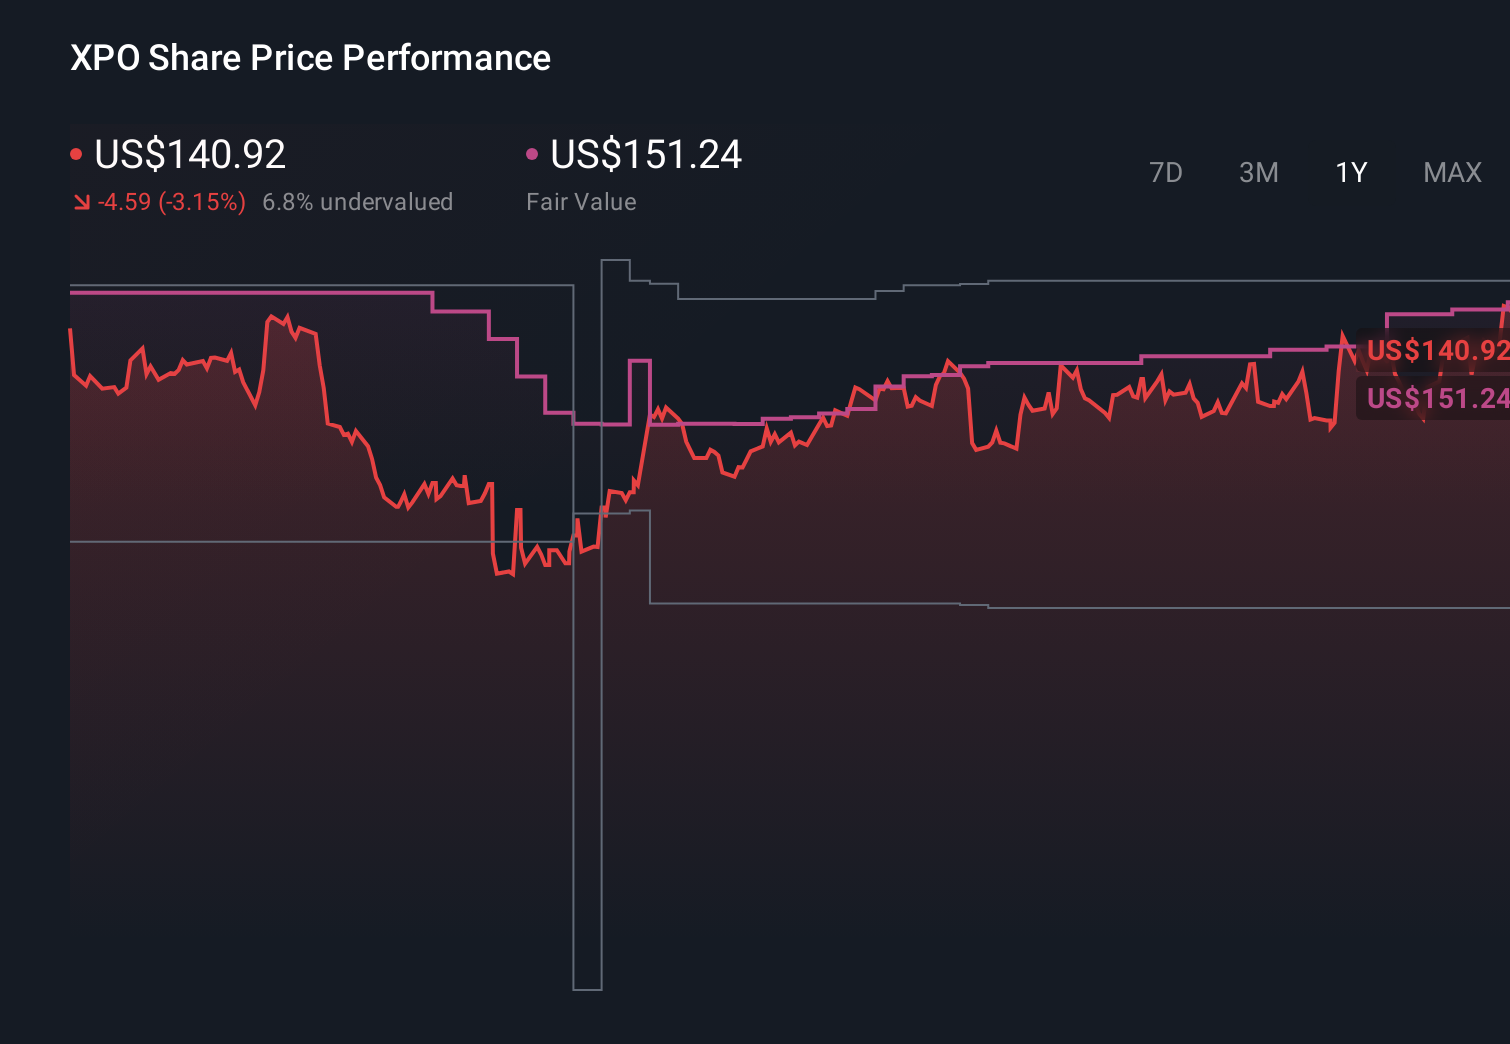
- XPO closed at US$195.33, with a 30.1% return over the last 30 days, a 40.7% return year to date, and a 34.1% return over the past year, while the 3‑year and 5‑year returns have also been very large.
- Recent coverage has focused on XPO's position as a major US transportation and logistics player and how investors are reacting to its role in freight and supply chain trends. This context helps explain why the stock's shorter term moves, including the 4.1% decline over the last 7 days alongside strong multi‑year returns, are attracting fresh attention.
- Despite this, XPO currently has a valuation score of 0 out of 6 on our checklist of potential undervaluation. We will next walk through what that means across different valuation methods and then finish with a way to think about value that goes beyond the usual ratios.
XPO scores just 0/6 on our valuation checks. See what other red flags we found in the full valuation breakdown.
Approach 1: XPO Discounted Cash Flow (DCF) Analysis
The Discounted Cash Flow model estimates what a business might be worth today by projecting its future cash flows and then discounting those cash flows back to a present value.
For XPO, the model used is a 2 Stage Free Cash Flow to Equity approach. The latest trailing twelve month free cash flow is reported as a loss of $27.63 million. Looking ahead, analysts and extrapolated estimates point to free cash flow of $981.00 million in 2029, with a path of projected cash flows between 2026 and 2035 that are discounted back to today using this framework from Simply Wall St.
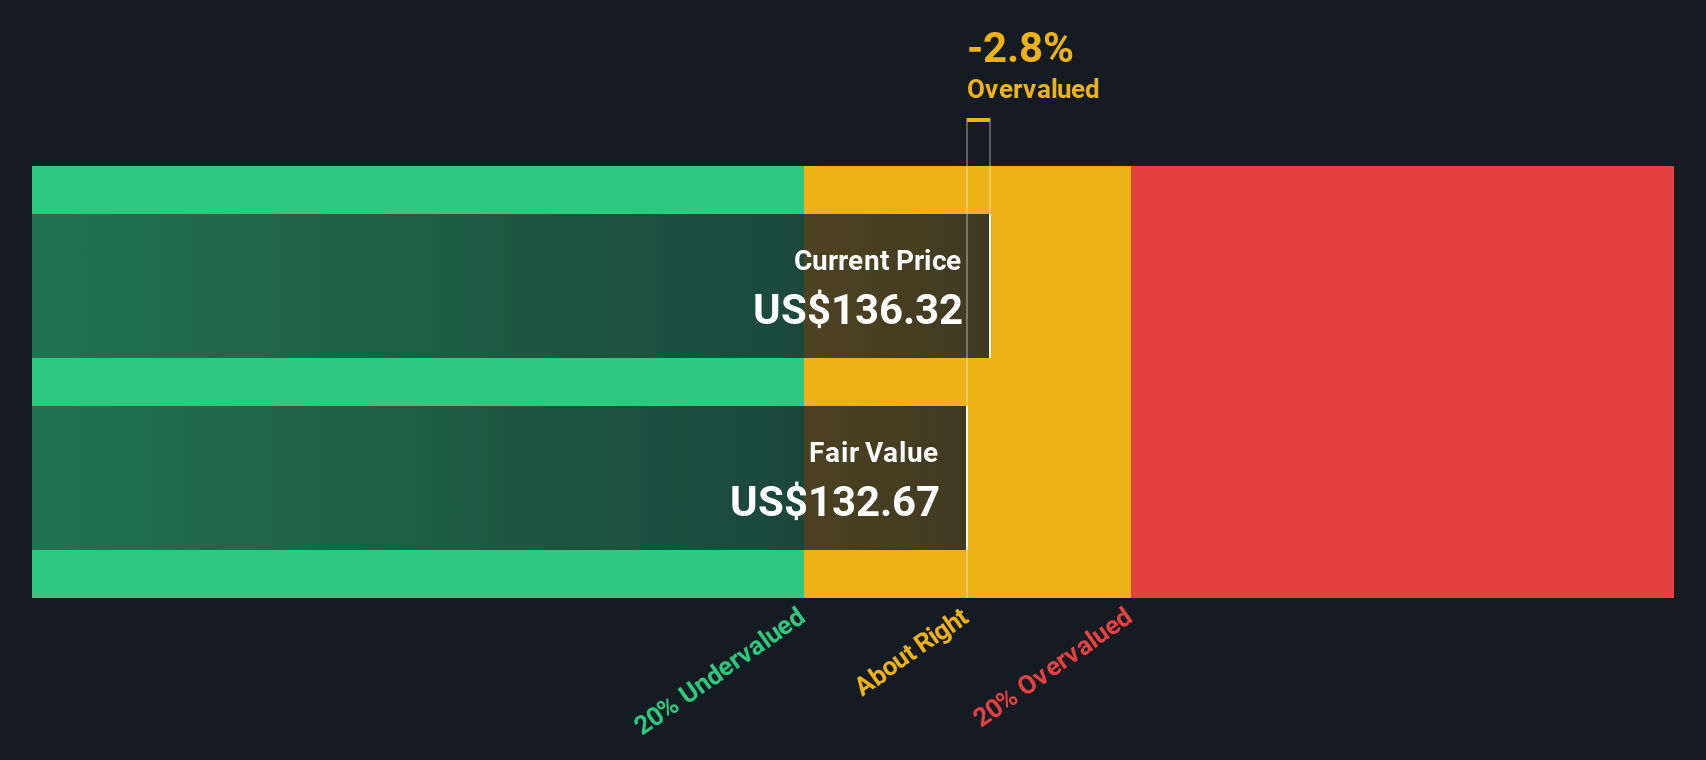
When those discounted cash flows are added up, the estimated intrinsic value comes out at US$176.90 per share. Compared with the recent share price of US$195.33, the DCF suggests XPO is about 10.4% overvalued on this measure.
Result: OVERVALUED
Our Discounted Cash Flow (DCF) analysis suggests XPO may be overvalued by 10.4%. Discover 53 high quality undervalued stocks or create your own screener to find better value opportunities.
Approach 2: XPO Price vs Earnings
For a profitable company, the P/E ratio is a useful way to relate what you pay for each share to the earnings that business is currently generating. It lets you compare how the market is pricing one company versus another using the same earnings based yardstick.
What counts as a “normal” P/E depends on what investors expect for future growth and how much risk they see in those earnings. Higher expected growth or lower perceived risk can justify a higher P/E, while slower growth or higher risk usually lines up with a lower P/E.
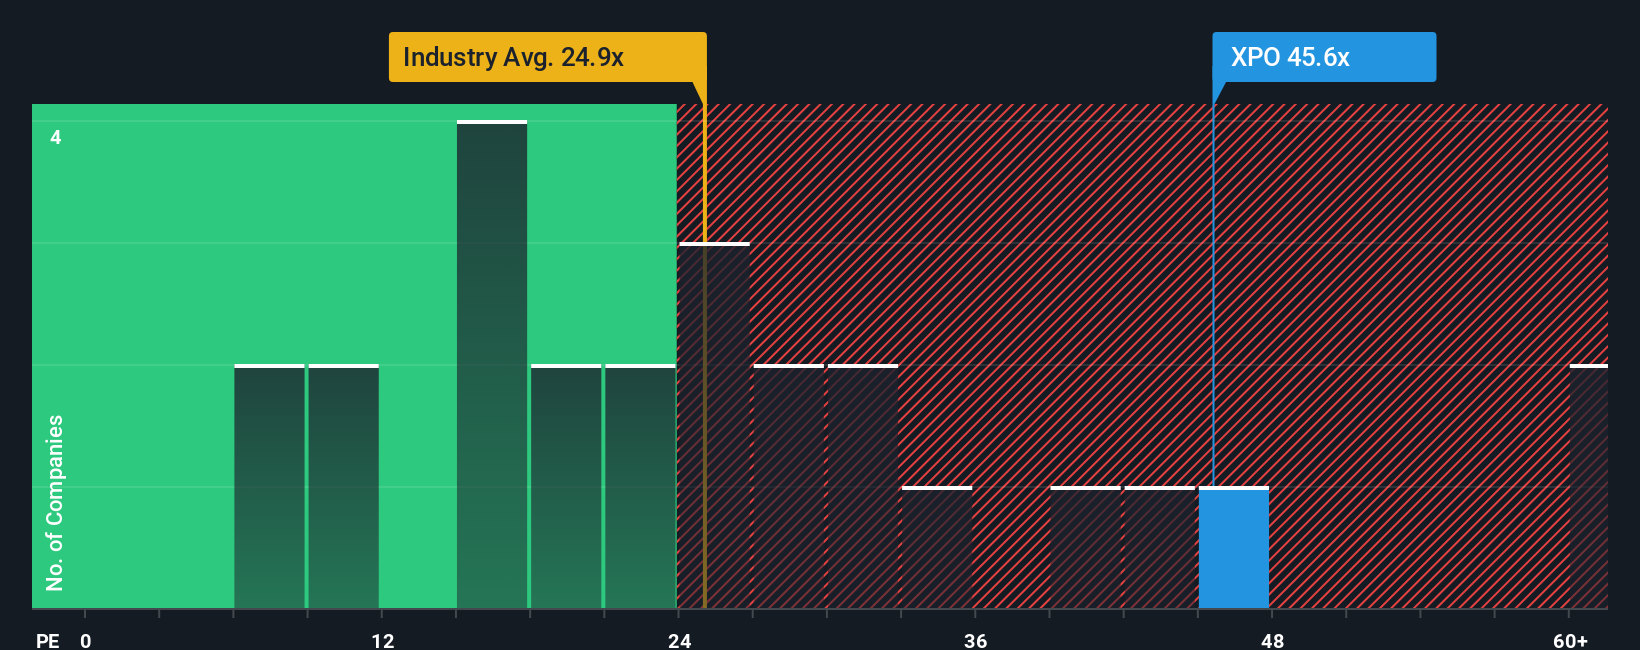
XPO currently trades on a P/E of 72.41x. That sits above the Transportation industry average P/E of 36.94x and above the peer group average of 65.31x. Simply Wall St’s Fair Ratio for XPO is 25.31x, which is its proprietary view of what the P/E might be given factors like the company’s earnings growth, industry, profit margins, market cap and risks.
The Fair Ratio is more tailored than a simple peer or industry comparison because it looks at XPO’s specific profile rather than assuming all companies in the group deserve similar multiples. Comparing 72.41x with the Fair Ratio of 25.31x suggests XPO is trading above this fair value estimate.
Result: OVERVALUED
P/E ratios tell one story, but what if the real opportunity lies elsewhere? Start investing in legacies, not executives. Discover our 23 top founder-led companies.
Upgrade Your Decision Making: Choose your XPO Narrative
Earlier we mentioned that there is an even better way to understand valuation, so let us introduce you to Narratives, which are simple stories you build around a company that connect your view of its future revenue, earnings and margins to a financial forecast and a fair value estimate.
On Simply Wall St, Narratives sit inside the Community page and let you say, in plain language, what you think is driving XPO. You can then tie that story to numbers like expected earnings in 2028 or a future P/E, so you can compare your Fair Value to today’s price and decide if the stock looks attractive or expensive to you.
Because Narratives refresh when new information such as news or earnings is added, you are not locked into a static view. You can see how different investors can look at the same company in very different ways. For example, one Narrative lines up with a Fair Value around US$180.00, while another anchors closer to US$105.46, with others using analyst targets like US$156.08 as their reference point.
Do you think there's more to the story for XPO? Head over to our Community to see what others are saying!
This article by Simply Wall St is general in nature. We provide commentary based on historical data and analyst forecasts only using an unbiased methodology and our articles are not intended to be financial advice. It does not constitute a recommendation to buy or sell any stock, and does not take account of your objectives, or your financial situation. We aim to bring you long-term focused analysis driven by fundamental data. Note that our analysis may not factor in the latest price-sensitive company announcements or qualitative material. Simply Wall St has no position in any stocks mentioned.
Have feedback on this article? Concerned about the content? Get in touch with us directly. Alternatively, email editorial-team@simplywallst.com