

Reassessing Doximity (DOCS) After Steep Share Price Declines
- If you are looking at Doximity and wondering whether the current share price offers value, this article will walk through what the numbers actually say rather than just the headlines.
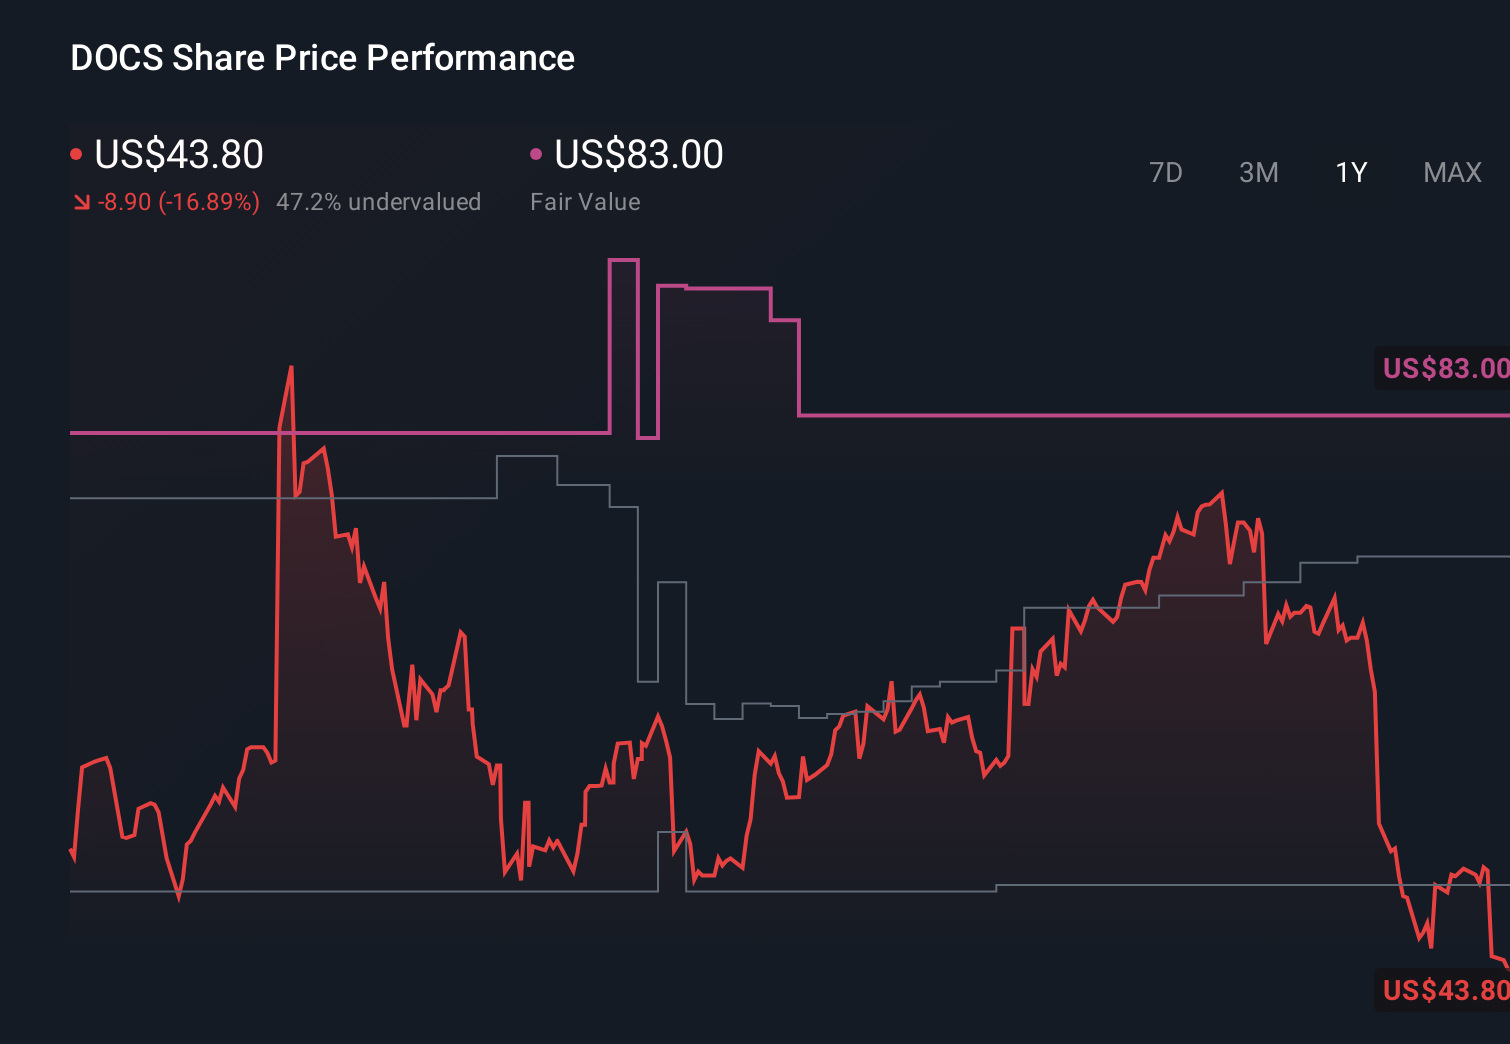
- The stock has recently been under pressure, with returns of a 9.8% decline over 7 days, 39.4% decline over 30 days, 42.2% decline year to date and 67.5% decline over the past year from a last close of US$25.02.
- Recent coverage has focused on Doximity as a leading digital platform for U.S. physicians and how its role in physician networking and digital tools fits into broader healthcare technology trends. At the same time, commentary has highlighted investor debate around how to value healthcare software businesses that blend advertising, recruiting and workflow products, which helps frame the current share price moves.
- On Simply Wall St's valuation checks, Doximity scores 5 out of 6, giving it a value score of 5. Next, we will look at how different valuation approaches arrive at that result and then finish with a way to put those numbers into a broader investment story.
Find out why Doximity's -67.5% return over the last year is lagging behind its peers.
Approach 1: Doximity Discounted Cash Flow (DCF) Analysis
A Discounted Cash Flow model estimates what a company could be worth today by projecting its future cash flows and then discounting those back to a present value.
For Doximity, the model used is a 2 Stage Free Cash Flow to Equity approach. The latest twelve month Free Cash Flow is about $306.6 million, and analysts and internal estimates project Free Cash Flow out to 2035. Within that, Simply Wall St shows a projected Free Cash Flow of $447.4 million by 2030, with earlier years such as 2026 and 2027 also in the $300 million range. Beyond the analyst horizon, the platform extrapolates cash flows using its own assumptions to complete the 10 year path.
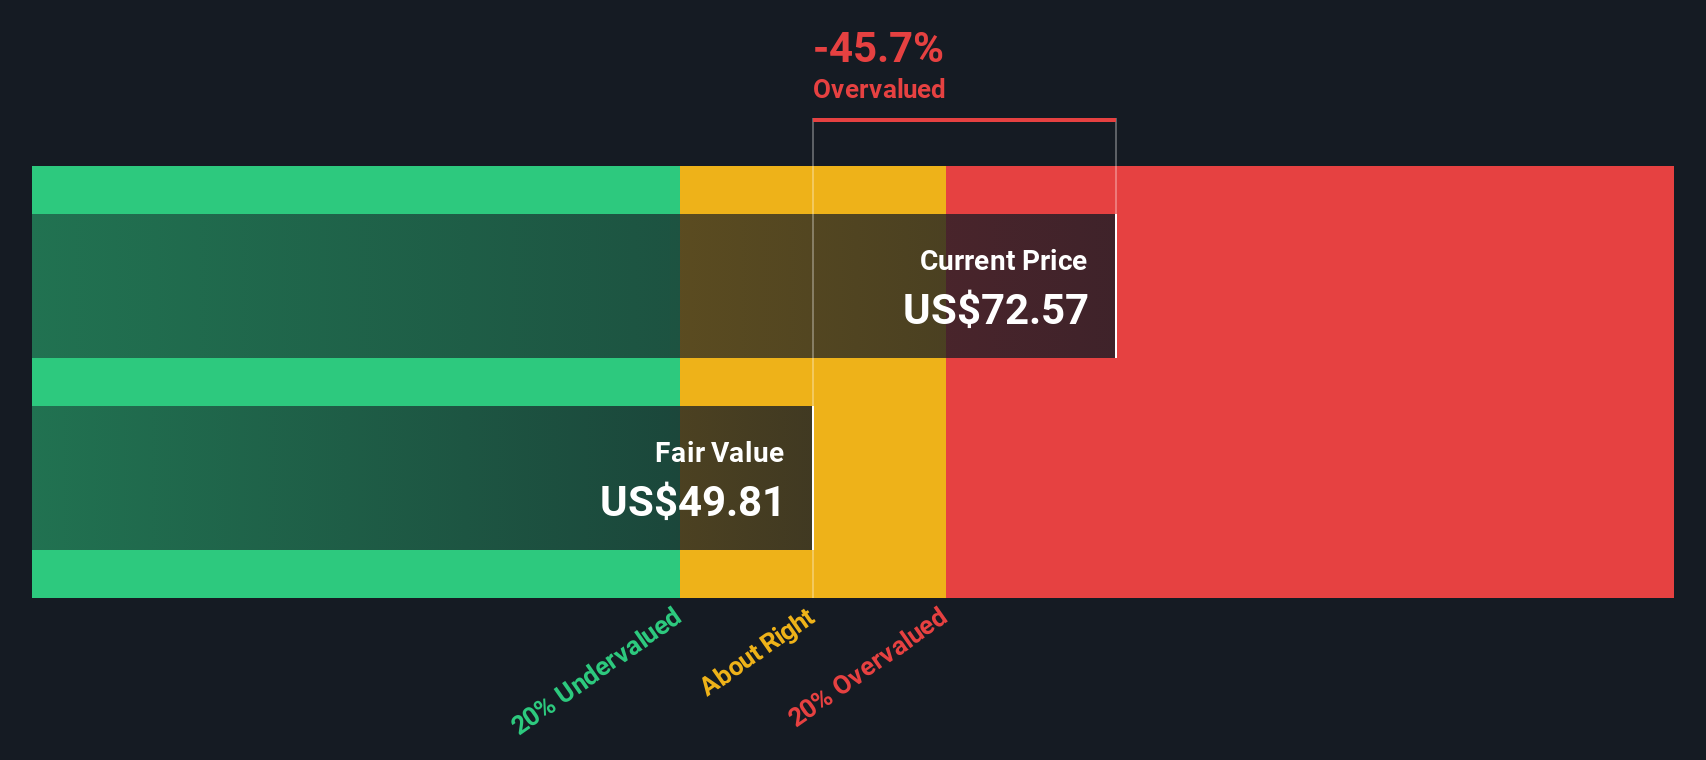
Bringing all those projected cash flows back to today gives an estimated intrinsic value of about $48.09 per share. Compared with the recent share price of US$25.02, the DCF output indicates roughly a 48.0% discount, which suggests the stock screens as undervalued on this model alone.
Result: UNDERVALUED
Our Discounted Cash Flow (DCF) analysis suggests Doximity is undervalued by 48.0%. Track this in your watchlist or portfolio, or discover 53 more high quality undervalued stocks.
Approach 2: Doximity Price vs Earnings
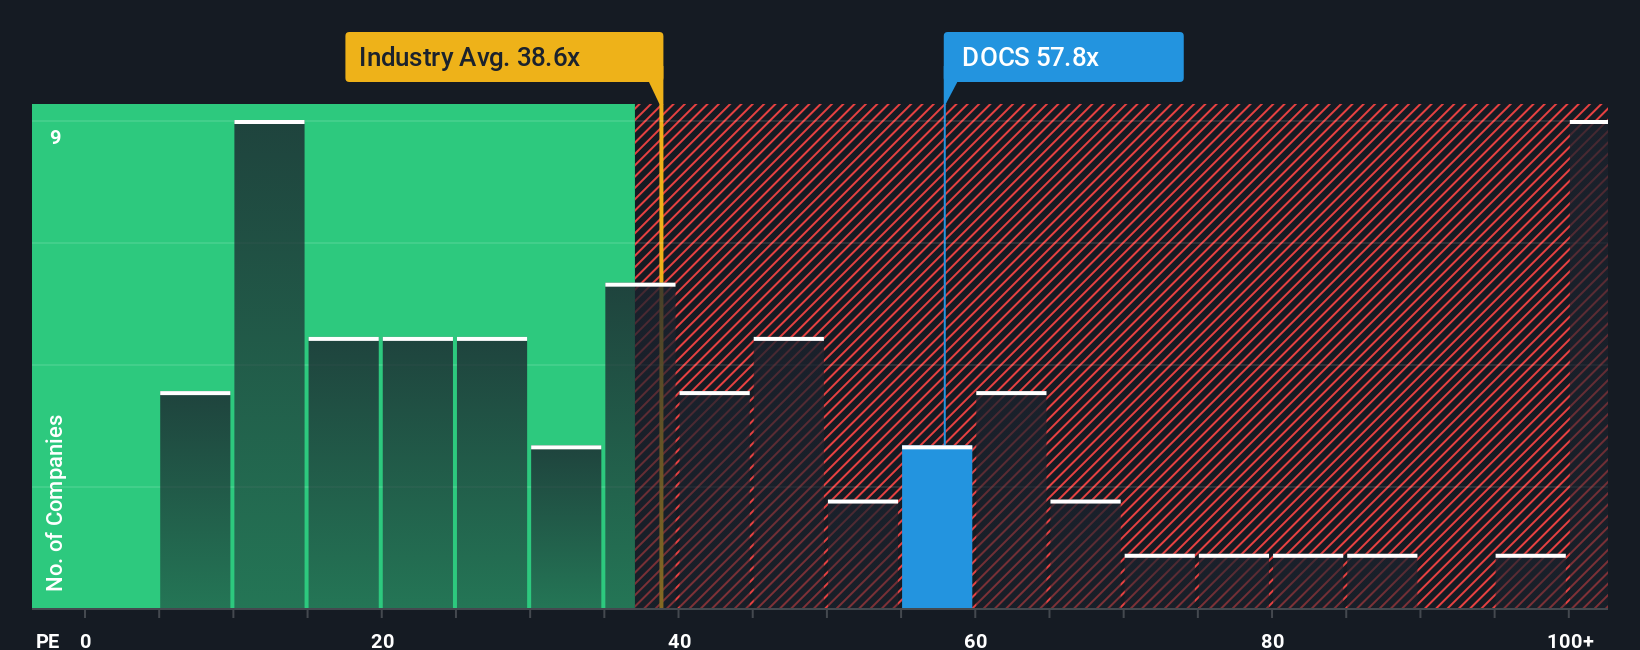
For a profitable company like Doximity, the P/E ratio is a useful yardstick because it links what you pay directly to the earnings the business is already generating. Investors usually accept a higher P/E when they expect stronger earnings growth or see lower risk in those earnings, and a lower P/E when growth expectations are more modest or the risk profile is higher.
Doximity currently trades on a P/E of 19.30x, compared with the Healthcare Services industry average of about 29.31x and a peer average of 48.02x. Simply Wall St also calculates a proprietary “Fair Ratio” of 19.85x for Doximity. This Fair Ratio reflects factors such as the company’s earnings growth profile, industry, profit margins, market cap and risk characteristics.
Because it is tailored to the company, the Fair Ratio can give you a more targeted reference point than a simple comparison with broad industry or peer averages, which may include businesses with very different growth and risk profiles. Setting Doximity’s actual P/E of 19.30x against the Fair Ratio of 19.85x suggests the current pricing is close to what this framework would indicate.
Result: ABOUT RIGHT
P/E ratios tell one story, but what if the real opportunity lies elsewhere? Start investing in legacies, not executives. Discover our 23 top founder-led companies.
Upgrade Your Decision Making: Choose your Doximity Narrative
Earlier we mentioned that there is an even better way to understand valuation, so let us introduce you to Narratives, which simply means writing down your story for Doximity and tying that story to specific assumptions about its future revenue, earnings, margins and what you see as a fair value.
On Simply Wall St, Narratives live in the Community page and give you an easy way to connect three pieces: the business story you believe, the financial forecast that flows from it, and the fair value those numbers imply, all presented in a format used by millions of other investors.
Once you have a Narrative, the platform compares your fair value to the current share price so you can decide for yourself whether Doximity looks closer to a buy, a hold or a sell based on your own assumptions. That view then updates automatically as new news, guidance or earnings are added to the model.
For example, one Doximity Narrative currently applies a fair value of about US$50.00 while another applies about US$78.58. This shows how two investors can read the same company, plug in different revenue, margin and P/E assumptions, and arrive at very different but clearly laid out conclusions.
Do you think there's more to the story for Doximity? Head over to our Community to see what others are saying!
This article by Simply Wall St is general in nature. We provide commentary based on historical data and analyst forecasts only using an unbiased methodology and our articles are not intended to be financial advice. It does not constitute a recommendation to buy or sell any stock, and does not take account of your objectives, or your financial situation. We aim to bring you long-term focused analysis driven by fundamental data. Note that our analysis may not factor in the latest price-sensitive company announcements or qualitative material. Simply Wall St has no position in any stocks mentioned.
Have feedback on this article? Concerned about the content? Get in touch with us directly. Alternatively, email editorial-team@simplywallst.com