


- If you are asking yourself whether McGraw Hill is priced attractively right now, this article will walk through what the current share price might be implying about the business.
- The stock last closed at US$13.67, with a recent 7 day return of 8.3%, a 30 day return of 5.7% decline, and a year to date return of 16.4% decline, which may have caught your eye if you are watching for changing risk and reward.
- Recent evergreen coverage interest around McGraw Hill has focused on how the market is weighing its position in the consumer services space and how investors are reassessing companies that are not in the spotlight as often as major indices. This context is useful when thinking about whether recent price moves are purely sentiment driven or tied to underlying fundamentals.
- Right now McGraw Hill scores 5 out of 6 on our valuation checks, and you can see that full scorecard at 5 out of 6. Next we will look at how standard methods like P/E, P/B and cash flow models line up, then finish with a different way of thinking about value that can help tie it all together.
Approach 1: McGraw Hill Discounted Cash Flow (DCF) Analysis
A Discounted Cash Flow, or DCF, model estimates what a business might be worth by projecting its future cash flows and discounting them back to today’s value. It is essentially asking what those future dollars are worth in today’s terms.
For McGraw Hill, the model used is a 2 Stage Free Cash Flow to Equity approach, based on cash flow projections. The latest twelve month free cash flow is about $354.1 million. Analysts provide specific forecasts out to 2028, where free cash flow is projected at $392.35 million, and further years out to 2035 are extrapolated using Simply Wall St estimates rather than additional analyst targets.
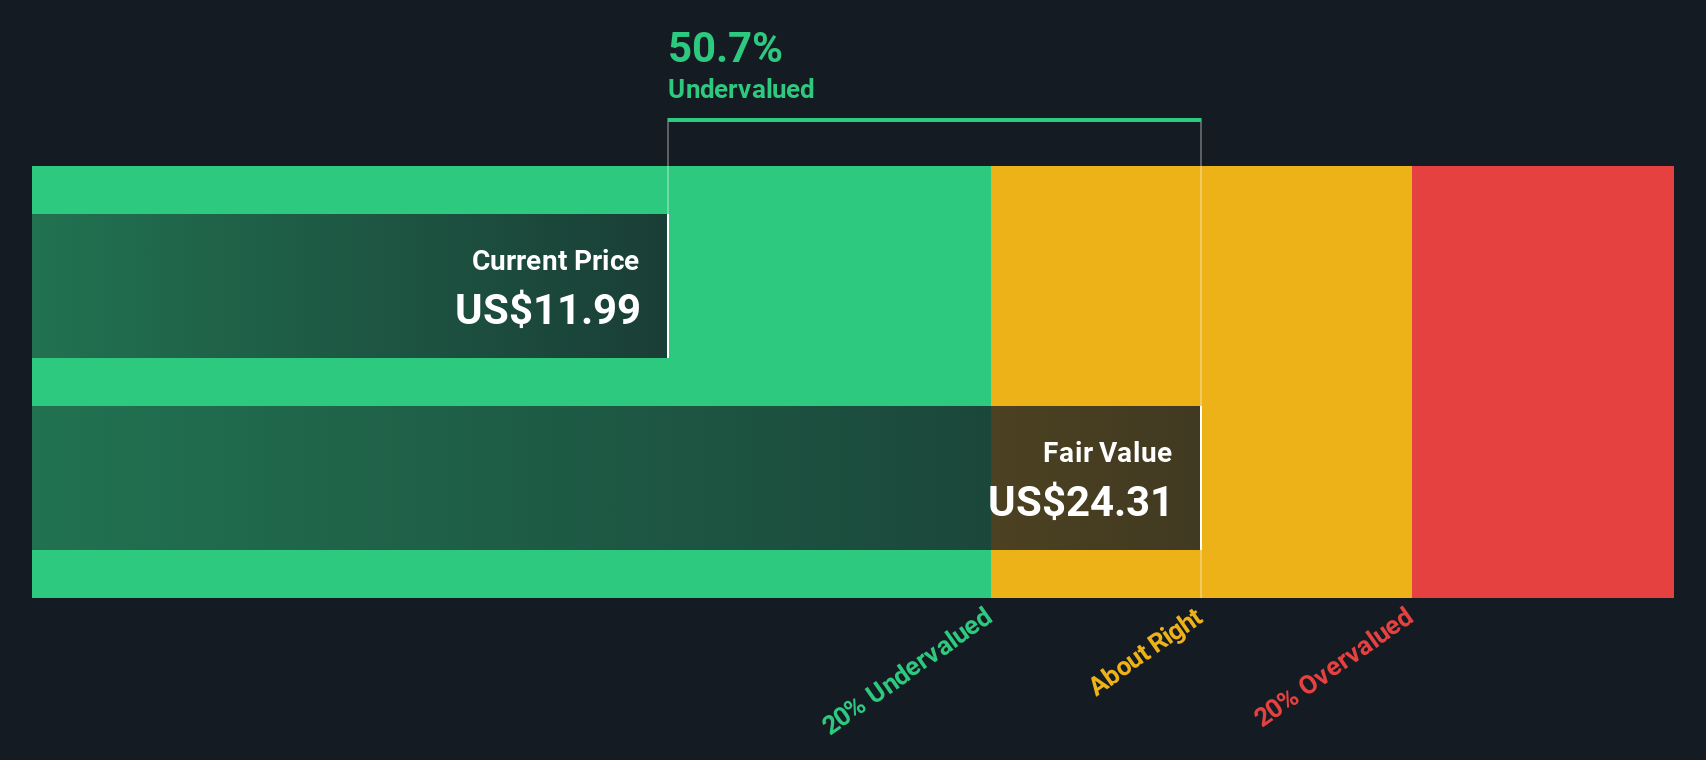
Pulling those annual figures together and discounting them, the DCF output suggests an intrinsic value of about US$35.56 per share. Against the recent share price of US$13.67, the model implies the stock is around 61.6% undervalued on these cash flow assumptions.
Result: UNDERVALUED
Our Discounted Cash Flow (DCF) analysis suggests McGraw Hill is undervalued by 61.6%. Track this in your watchlist or portfolio, or discover 53 more high quality undervalued stocks.
Approach 2: McGraw Hill Price vs Sales
For companies where revenue is a key anchor and earnings can be influenced by accounting or one off items, the P/S ratio is often a useful way to think about value. It compares what investors are paying for each dollar of sales, which can be easier to interpret than earnings based metrics in some cases.
What counts as a normal P/S ratio depends on the growth investors expect and how risky those sales are. Higher expected growth or more resilient revenue can justify a higher multiple, while slower growth or higher risk usually points to a lower one.
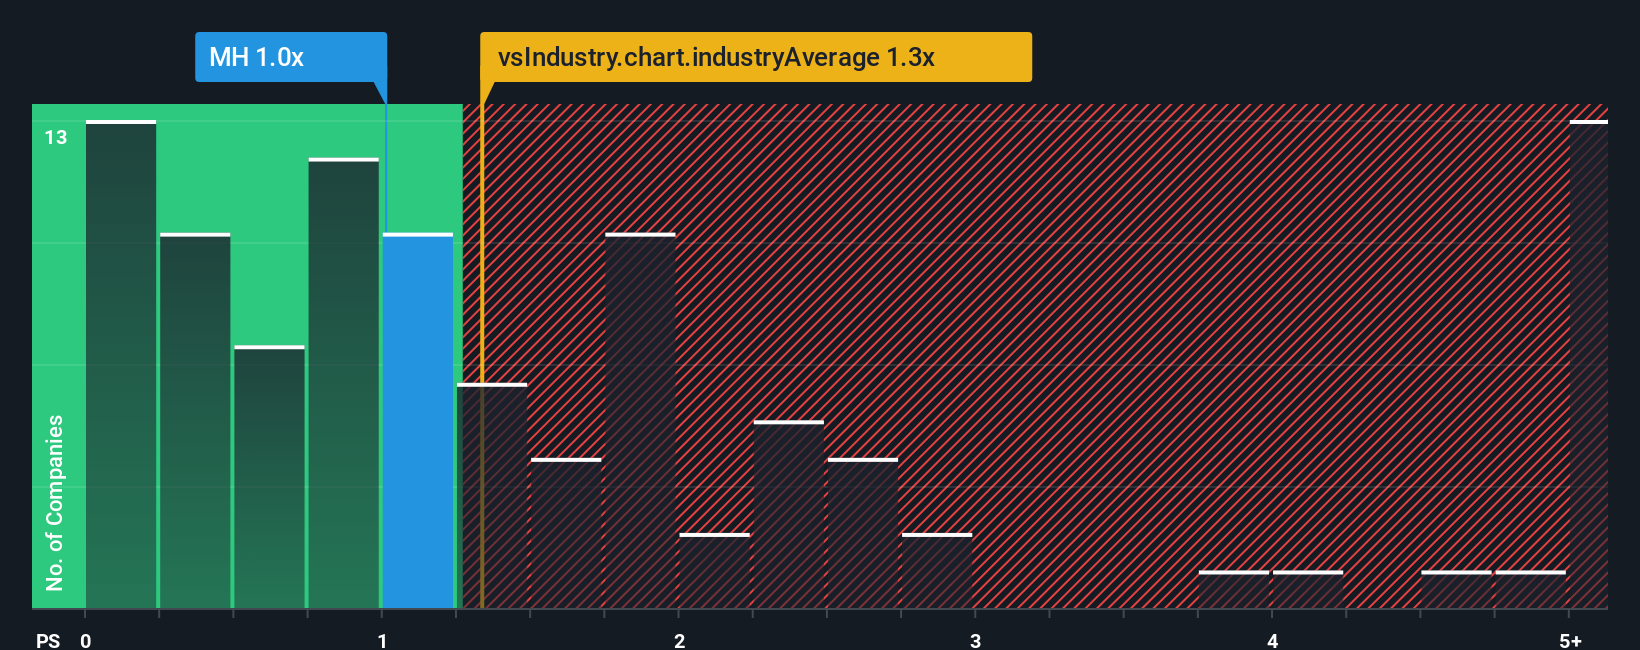
McGraw Hill currently trades on a P/S ratio of 1.24x, compared with the Consumer Services industry average of about 1.24x and a peer group average of 1.76x. Simply Wall St also calculates a Fair Ratio of 1.71x for McGraw Hill using a proprietary model that looks at factors like earnings growth, profit margins, industry, market cap and company specific risks. This Fair Ratio aims to be more tailored than a simple comparison with peers or the broad industry, since it adjusts for McGraw Hill’s own characteristics rather than assuming it should trade in line with an average.
Comparing the Fair Ratio of 1.71x with the current 1.24x P/S indicates that the shares are trading below that model based estimate of fair value.
Result: UNDERVALUED
P/S ratios tell one story, but what if the real opportunity lies elsewhere? Start investing in legacies, not executives. Discover our 23 top founder-led companies.
Upgrade Your Decision Making: Choose your McGraw Hill Narrative
Earlier we mentioned that there is an even better way to understand valuation. Let us introduce you to Narratives, which are simply your story about McGraw Hill, tied to your own assumptions for future revenue, earnings and margins, translated into a Fair Value that you can compare with today’s price.
On Simply Wall St’s Community page, Narratives let you set out why you think the business looks the way it does, plug that view into a forecast, see the Fair Value that results from those numbers, and then quickly compare it to the current share price to help you decide whether you see the stock as attractive, expensive or somewhere in between, on your terms.
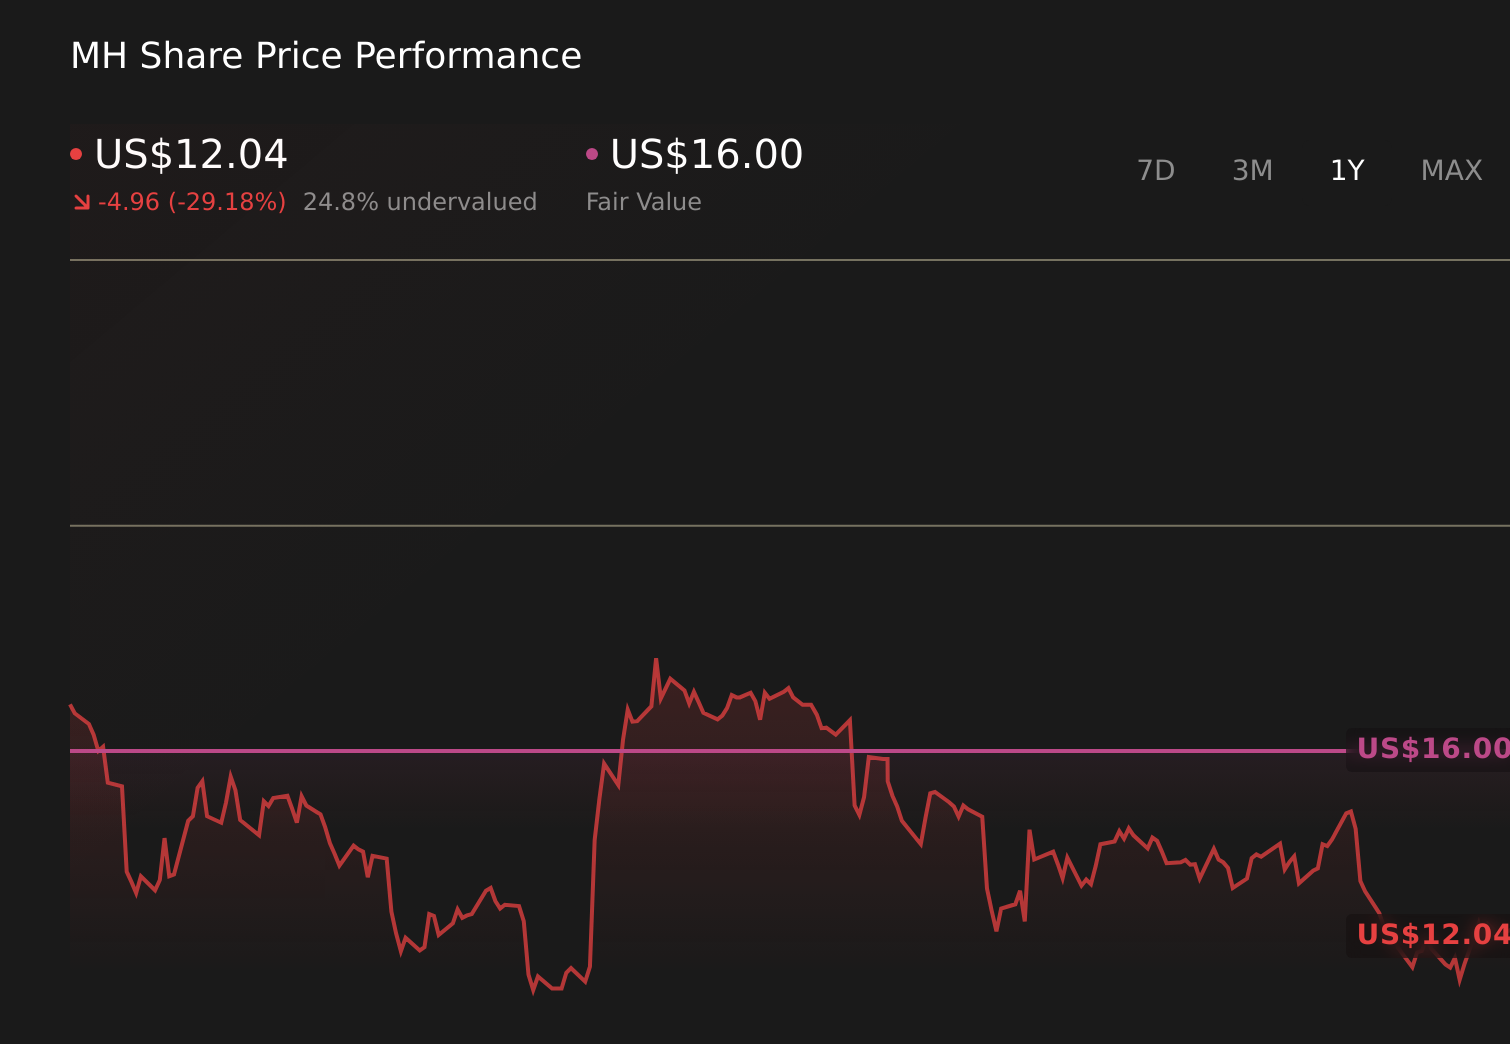
Narratives update as new information, such as earnings or news, is added to the platform. You can also see how different investors think about the same company, for example one McGraw Hill Narrative that targets a Fair Value of about US$16.00, another that targets around US$26.54, and a middle case around US$20.83, each reflecting different views on how its digital mix, AI tools and K 12 cycles might be reflected in the numbers.
Do you think there's more to the story for McGraw Hill? Head over to our Community to see what others are saying!
This article by Simply Wall St is general in nature. We provide commentary based on historical data and analyst forecasts only using an unbiased methodology and our articles are not intended to be financial advice. It does not constitute a recommendation to buy or sell any stock, and does not take account of your objectives, or your financial situation. We aim to bring you long-term focused analysis driven by fundamental data. Note that our analysis may not factor in the latest price-sensitive company announcements or qualitative material. Simply Wall St has no position in any stocks mentioned.
Have feedback on this article? Concerned about the content? Get in touch with us directly. Alternatively, email editorial-team@simplywallst.com