

WEX (WEX) EPS Jump In Q4 Reinforces Bullish Long Term Earnings Narratives
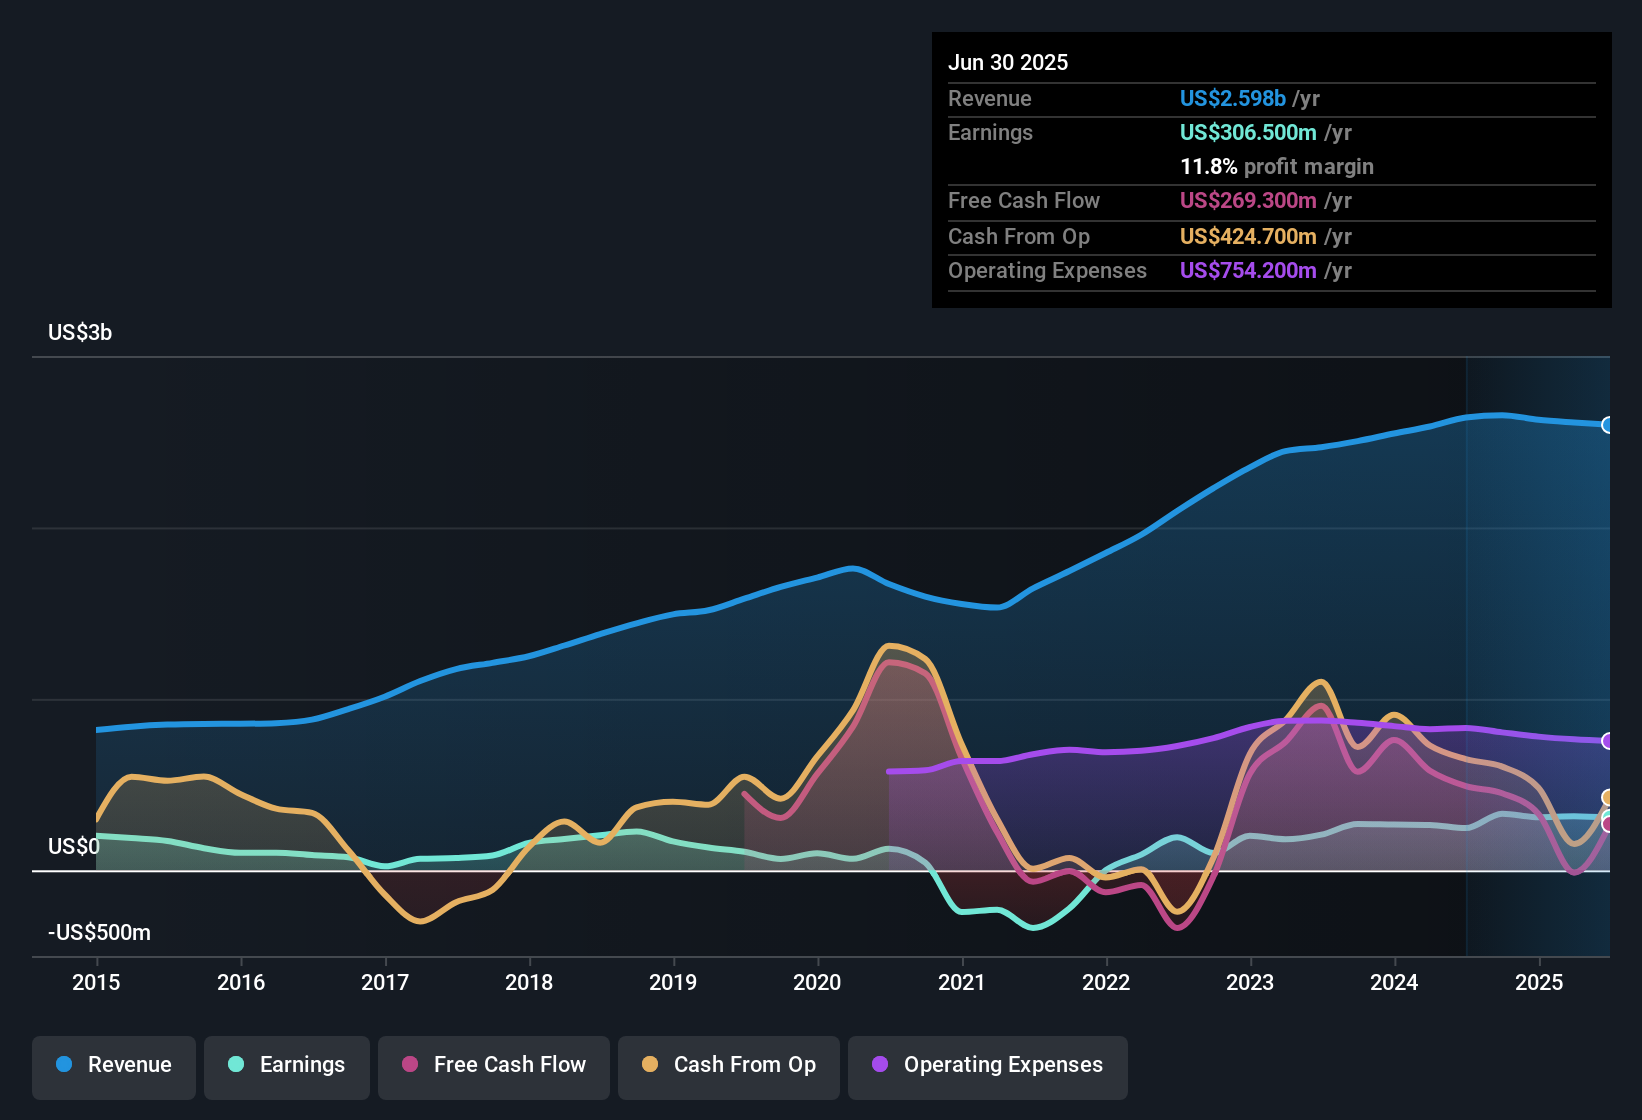
WEX (WEX) has just wrapped up FY 2025 with Q4 revenue of US$672.9 million and basic EPS of US$2.45, while full year trailing twelve month revenue came in at about US$2.7 billion and EPS at US$8.57. Over recent quarters the company has seen revenue move from US$636.5 million in Q4 2024 to US$672.9 million in Q4 2025, with basic EPS shifting from US$1.62 to US$2.45 over the same period, giving investors a clear view of how the top and bottom lines have tracked into this latest print. With a trailing net margin of 11.4% versus 11.8% last year, the story now turns to how investors weigh slightly softer profitability against the growth profile implied in the current numbers.
See our full analysis for WEX.With the headline figures on the table, the next step is to see how they line up with the widely followed narratives around WEX, and where the numbers may challenge what the market thinks it knows.
See what the community is saying about WEX
TTM earnings of US$304 million versus 5 year growth story
- On a trailing twelve month basis, WEX reported net income of US$304.1 million and EPS of US$8.57, compared with five year earnings growth that averaged 51.1% per year even though the most recent one year window showed weaker earnings than that longer term trend.
- Bulls point out that this kind of long term earnings build supports their view that WEX can keep growing. However, the recent step down from the five year growth rate means:
- It heavily supports the bullish idea of durable earnings power, but also reminds you that even strong multi year growth can include softer twelve month patches.
- It gives you a concrete reference point to test bullish forecasts against, because any future growth assumptions have to stack up against both the US$304.1 million base and that 51.1% long run history.
Bulls argue that the current results are just one chapter in a much bigger growth story, and that the real question is whether earnings can compound from here in the way they expect. 🐂 WEX Bull Case
Margins steady at 11.4% while costs stay in focus
- Net margin for the trailing twelve months sits at 11.4%, slightly below the 11.8% level reported last year. This means about 11 cents of every US$1 of the US$2.66b in revenue turns into net income.
- Bears argue that rising technology, sales, and regulatory costs could keep pressuring margins, and the current numbers give them some support:
- The small move from 11.8% to 11.4% lines up with their concern that expenses may grow faster than revenue if cost programs do not fully offset new spending.
- At the same time, the margin is still solidly positive, so anyone leaning on the bearish case has to balance that cost worry against the fact that WEX is currently converting a meaningful share of revenue into profit.
Skeptics warn that if WEX keeps investing heavily without a clear uplift in this 11.4% margin, the bearish focus on cost pressure and profitability will stay front and center. 🐻 WEX Bear Case
Valuation gap, with P/E above peers and DCF at US$402
- WEX trades at US$157.67 per share, on a P/E of 17.8x versus peer and industry averages of 14.4x and 15.8x, while a DCF fair value of about US$402.18 per share points to a large gap between the current price and that cash flow based estimate.
- What is interesting is how this mix of numbers plays into both bullish and bearish talking points:
- Supporters can point to the DCF fair value being well above US$157.67 and to forecast earnings growth of about 13.7% per year as reasons the current price could be conservative relative to that model.
- Critics, though, can highlight that paying a 17.8x P/E that is higher than peers and the wider US Diversified Financial group looks demanding given revenue growth forecasts of roughly 4.1% per year and the small dip in net margin from 11.8% to 11.4%.
Next Steps
To see how these results tie into long-term growth, risks, and valuation, check out the full range of community narratives for WEX on Simply Wall St. Add the company to your watchlist or portfolio so you'll be alerted when the story evolves.
See the numbers differently? If you think the data points to a different story, shape your own view in just a few minutes and Do it your way.
A good starting point is our analysis highlighting 2 key rewards investors are optimistic about regarding WEX.
Explore Alternatives
WEX is facing tension between a P/E above peers, slightly softer margins at 11.4%, and revenue growth forecasts that trail its earnings growth expectations.
If that mix of rich pricing and margin pressure feels uncomfortable, check out our 53 high quality undervalued stocks that pairs solid fundamentals with more modest valuations and see what else could fit your portfolio today.
This article by Simply Wall St is general in nature. We provide commentary based on historical data and analyst forecasts only using an unbiased methodology and our articles are not intended to be financial advice. It does not constitute a recommendation to buy or sell any stock, and does not take account of your objectives, or your financial situation. We aim to bring you long-term focused analysis driven by fundamental data. Note that our analysis may not factor in the latest price-sensitive company announcements or qualitative material. Simply Wall St has no position in any stocks mentioned.
Have feedback on this article? Concerned about the content? Get in touch with us directly. Alternatively, email editorial-team@simplywallst.com