

Does Hanover Insurance Group (THG) Offer Value After Strong Five Year Share Price Gains
- If you are wondering whether Hanover Insurance Group's share price still reflects its underlying worth, this article walks through the key numbers that matter before you commit fresh capital.
- The stock closed at US$171.80, with returns of 1.1% over 30 days, 7.8% over 1 year, 29.3% over 3 years and 70.4% over 5 years. This recent price history gives useful context for judging current value and risk.
- Recent coverage has focused on Hanover Insurance Group's position in the US insurance sector and how investors are reacting to its underwriting and capital allocation track record. This background helps explain why the share price has moved the way it has over the short and medium term.
- On our valuation checks, Hanover Insurance Group has a score of 5 out of 6. This sets up a closer look at traditional valuation tools like P/E, P/B and cash flow models. Later in the article we will also look at a broader way to think about what this business could be worth.
Approach 1: Hanover Insurance Group Excess Returns Analysis
The Excess Returns model looks at how efficiently Hanover Insurance Group turns its equity base into profits, then compares those returns with the return that shareholders are estimated to require. The gap between the two, the excess return, is capitalised to estimate what the shares could be worth today.
For Hanover Insurance Group, book value is $100.89 per share and analysts see a stable book value of $120.80 per share, based on weighted estimates from 5 analysts. Stable EPS is $18.97 per share, sourced from weighted future Return on Equity estimates from 6 analysts, against an average Return on Equity of 15.71%.
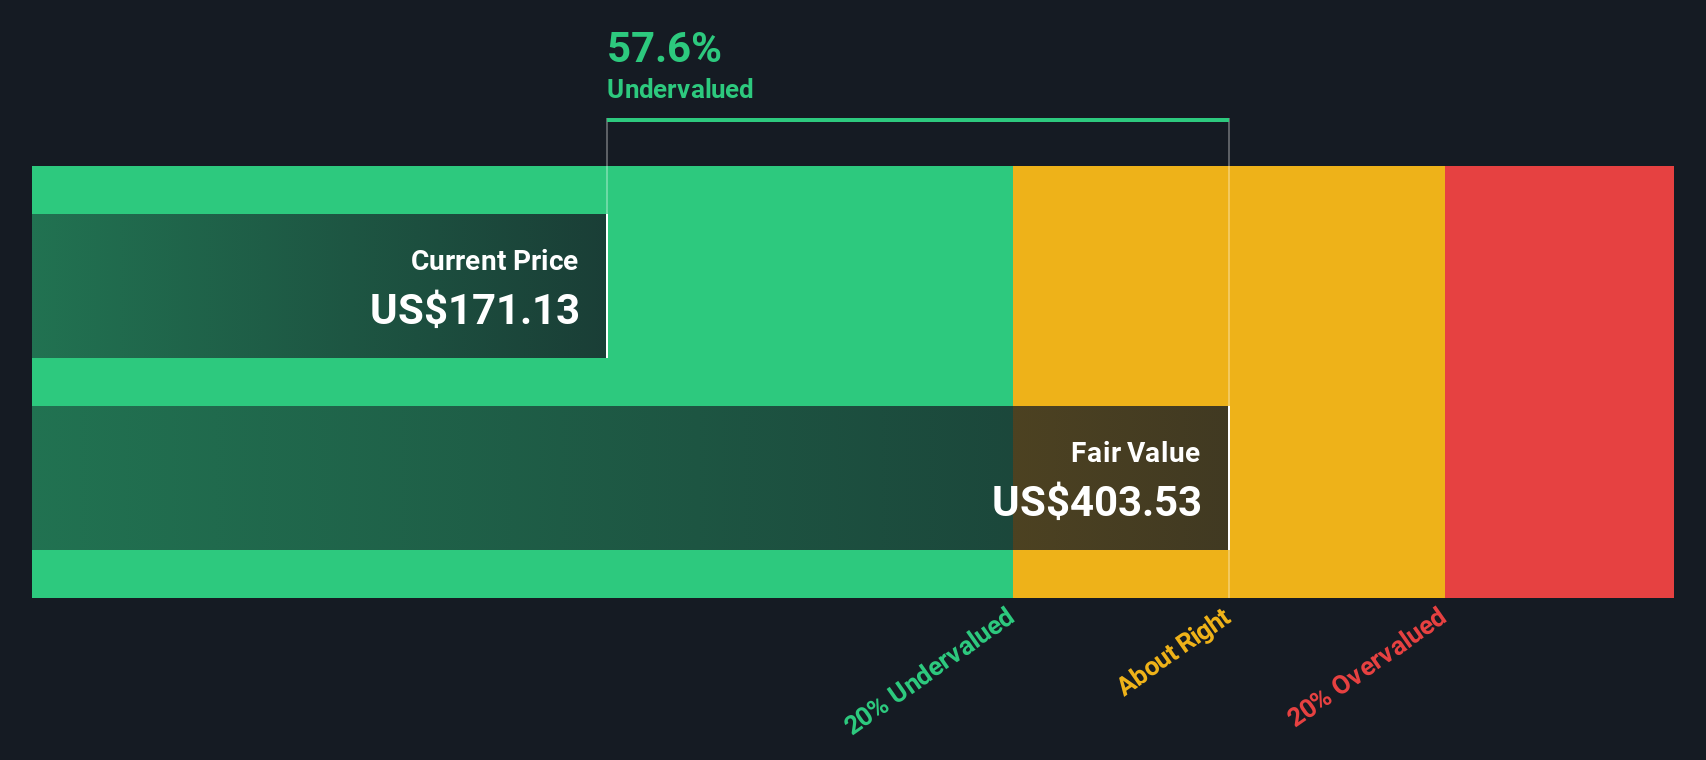
The model applies a cost of equity of $8.43 per share, which implies an excess return of $10.54 per share. When Simply Wall St aggregates these excess returns over time, it arrives at an intrinsic value of about $416.29 per share. Compared with the recent share price of US$171.80, the Excess Returns valuation implies the stock is 58.7% undervalued.
Result: UNDERVALUED
Our Excess Returns analysis suggests Hanover Insurance Group is undervalued by 58.7%. Track this in your watchlist or portfolio, or discover 53 more high quality undervalued stocks.
Approach 2: Hanover Insurance Group Price vs Earnings
For a profitable insurer like Hanover Insurance Group, the P/E ratio is a straightforward way to relate what you pay per share to the earnings the business generates. Investors usually accept a higher or lower P/E depending on what they expect for future earnings growth and how much risk they see in those earnings.
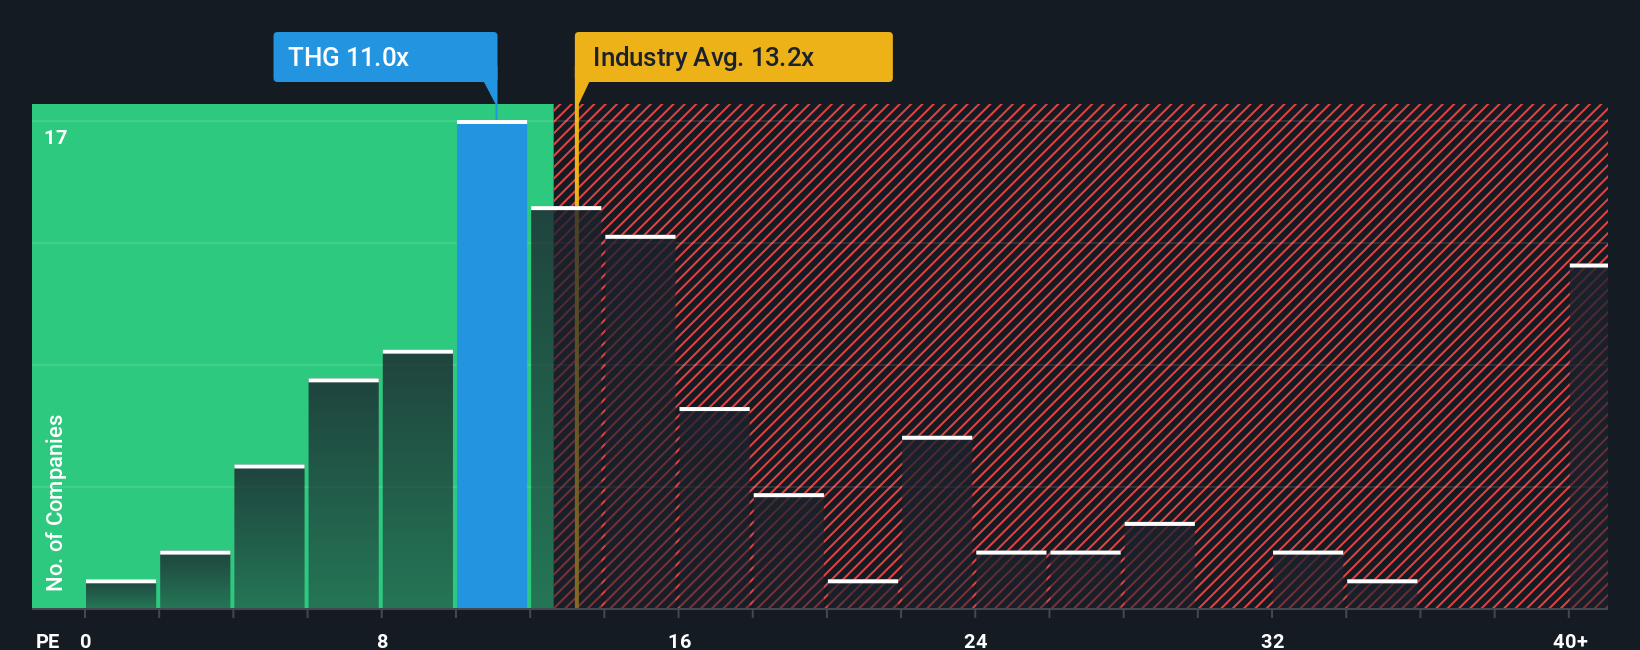
Hanover Insurance Group currently trades on a P/E of 9.20x. That sits below the Insurance industry average P/E of 12.33x and also below the peer average of 11.03x, which suggests the market is assigning a lower earnings multiple than many comparable names.
Simply Wall St’s Fair Ratio for Hanover Insurance Group is 11.05x. This is a proprietary estimate of what a reasonable P/E could look like, based on factors such as the company’s earnings growth profile, profit margins, risk characteristics, market cap and its industry. Because it incorporates these company specific inputs, the Fair Ratio can be more informative than a simple comparison with peers or the broad industry. With the current P/E of 9.20x sitting below the 11.05x Fair Ratio, the shares screen as undervalued on this multiple view.
Result: UNDERVALUED
P/E ratios tell one story, but what if the real opportunity lies elsewhere? Start investing in legacies, not executives. Discover our 23 top founder-led companies.
Upgrade Your Decision Making: Choose your Hanover Insurance Group Narrative
Earlier we mentioned that there is an even better way to think about valuation, and on Simply Wall St this comes to life through Narratives. You combine your view of Hanover Insurance Group’s story with your own assumptions for future revenue, earnings, margins and a fair value, then compare that fair value with today’s share price. The platform keeps it updated automatically as fresh news or earnings arrive. For example, one investor on the Community page might build a Narrative that leans on the recent buybacks, dividend and analyst fair value of about US$199.63 per share to argue the shares still offer upside. Another might focus on the catastrophe and competitive risks in the same dataset and decide that the current price already reflects their fair value. Both can clearly see how their story links to a forecast and a number they can use to decide whether the stock looks worth buying, holding or selling.
Do you think there's more to the story for Hanover Insurance Group? Head over to our Community to see what others are saying!

This article by Simply Wall St is general in nature. We provide commentary based on historical data and analyst forecasts only using an unbiased methodology and our articles are not intended to be financial advice. It does not constitute a recommendation to buy or sell any stock, and does not take account of your objectives, or your financial situation. We aim to bring you long-term focused analysis driven by fundamental data. Note that our analysis may not factor in the latest price-sensitive company announcements or qualitative material. Simply Wall St has no position in any stocks mentioned.
Have feedback on this article? Concerned about the content? Get in touch with us directly. Alternatively, email editorial-team@simplywallst.com