

Is It Time To Reassess BrightView Holdings (BV) After A 3 Year 108.7% Return?
- If you are wondering whether BrightView Holdings at around US$13.67 is starting to look like good value, you are not alone. This article is here to break that question down clearly.
- The stock has returned 0.9% over the last 7 days, 3.5% over 30 days and 8.5% year to date, while the 1 year return is a 6.8% decline and the 3 year return stands at 108.7% compared with a 13.8% decline over 5 years.
- Recent interest in BrightView has been shaped by ongoing attention on outsourced commercial services companies and how investors are weighing contract visibility, cost controls and demand for recurring maintenance work. These themes help frame why the share price has moved the way it has over different time frames and why valuation is now a key focus for many shareholders.
- On our checks, BrightView earns a valuation score of 5 out of 6, which suggests there is plenty to unpack across different valuation methods. We will look at those next before finishing with a way to assess value that goes beyond the usual ratios and models.
Find out why BrightView Holdings's -6.8% return over the last year is lagging behind its peers.
Approach 1: BrightView Holdings Discounted Cash Flow (DCF) Analysis
A Discounted Cash Flow model takes the cash BrightView Holdings is expected to generate in the future, then discounts those projections back to today to estimate what the business might be worth right now.
BrightView last reported trailing twelve month Free Cash Flow of about $126.2 million. Using a 2 Stage Free Cash Flow to Equity model, analysts provide explicit forecasts out to 2027, including $153.8 million of Free Cash Flow in 2027. Beyond that, Simply Wall St extrapolates ten year projections, with discounted Free Cash Flow estimates ranging from about $95.1 million in 2026 to $116.5 million in 2035, all in $ and all below $1b.
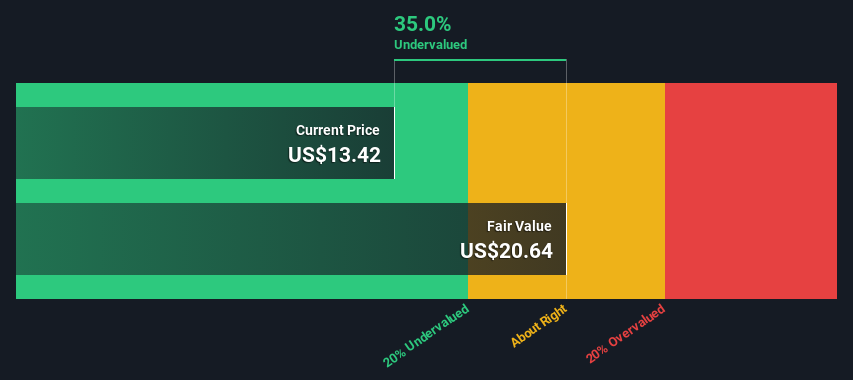
When all those future cash flows are added up and discounted, the model arrives at an estimated intrinsic value of about $40.75 per share. Compared with the recent share price of around $13.67, this points to an implied discount of roughly 66.5%. Under this method, the shares screen as undervalued.
Result: UNDERVALUED
Our Discounted Cash Flow (DCF) analysis suggests BrightView Holdings is undervalued by 66.5%. Track this in your watchlist or portfolio, or discover 53 more high quality undervalued stocks.
Approach 2: BrightView Holdings Price vs Sales
For companies where revenue is a key driver and earnings can be influenced by accounting items, the P/S ratio is often a useful way to compare what investors are paying for each dollar of sales. It is especially helpful when you want to strip the focus back to the top line rather than short term swings in profit.
In general, higher expected growth and lower perceived risk can support a higher P/S multiple, while slower growth or higher risk usually lines up with a lower, more conservative range. That context matters when you look at where BrightView trades today.
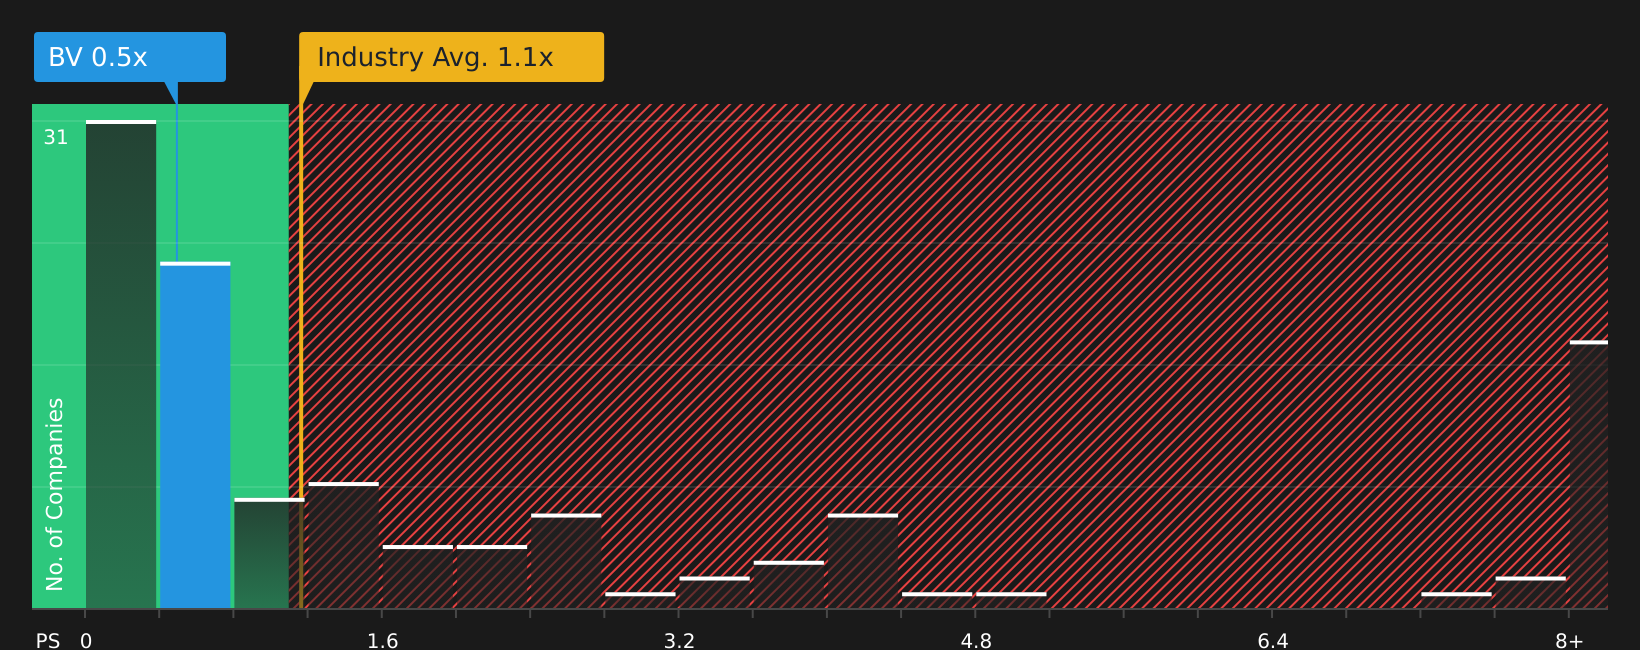
BrightView’s current P/S ratio is 0.48x, compared with the Commercial Services industry average of 1.27x and a peer group average of 1.60x. Simply Wall St’s Fair Ratio for BrightView comes out at 0.68x, which is its proprietary estimate of a suitable P/S after considering factors such as earnings growth, profit margins, size, risk profile and the company’s industry. This tailored Fair Ratio aims to be more informative than a simple comparison with peers or the sector, because it adjusts for BrightView’s own characteristics rather than assuming all companies deserve the same multiple. With the actual P/S at 0.48x and the Fair Ratio at 0.68x, the shares screen as undervalued on this metric.
Result: UNDERVALUED
P/S ratios tell one story, but what if the real opportunity lies elsewhere? Start investing in legacies, not executives. Discover our 23 top founder-led companies.
Upgrade Your Decision Making: Choose your BrightView Holdings Narrative
Earlier we mentioned that there is an even better way to understand valuation, so let us introduce you to Narratives, which are simply your story about a company linked directly to your own assumptions for future revenue, earnings, margins and a fair value estimate.
On Simply Wall St’s Community page, you can pick or create a Narrative for BrightView Holdings that connects the company’s business story to a forecast and then to a fair value, so you can quickly compare that fair value to the current share price to help decide whether you see it as an opportunity or something to be cautious about.
Narratives update automatically when new earnings, guidance or news is added to the platform, which means your view does not sit frozen in time. It adjusts as the facts change without you needing to rebuild a model from scratch.
For example, one BrightView Holdings Narrative on the platform currently anchors on a fair value of about US$11.10 while another uses US$24.00, showing how two investors can look at the same company, plug in different growth, margin and P/E assumptions, and arrive at very different yet clearly explained views.
For BrightView Holdings however we will make it really easy for you with previews of two leading BrightView Holdings Narratives:
🐂 BrightView Holdings Bull Case
Fair value: about US$16.06 per share
Implied discount versus the recent US$13.67 share price: roughly 14.9% below this fair value
Revenue growth used in this narrative: 2.37% per year
- Focuses on expanding into new development branches that link into an existing US$1.2b project backlog and are aimed at lifting recurring maintenance revenue over time.
- Highlights the One BrightView program, centralized procurement, technology spend and fleet upgrades as key drivers of higher margins and more stable profitability.
- Sees improved employee retention and ongoing buybacks, alongside a 2.7% revenue growth assumption and thicker profit margins, as supportive of stronger future shareholder returns if execution stays on track.
🐻 BrightView Holdings Bear Case
Fair value: about US$11.10 per share
Implied premium versus the recent US$13.67 share price: roughly 23.1% above this fair value
Revenue growth used in this narrative: 1.51% per year
- Flags structural shifts toward drought resistant solutions, artificial turf and automation as a risk to demand for BrightView's traditional services and to longer term revenue stability.
- Emphasizes the pressure that labor costs, regulation and debt servicing could put on margins, cash flows and the ability to invest in upgrades or acquisitions.
- Frames the bearish US$13.50 price target around more modest 1.5% revenue growth, thinner future margins and a lower 15.63x P/E, which together imply the current share price sits ahead of this narrative's fair value.
Once you have a sense of which story feels closer to your own expectations, you can use the full Narratives on Simply Wall St to adjust the revenue, margin and P/E inputs and see how your view of BrightView's value compares with the current price.
Curious how numbers become stories that shape markets? Explore Community Narratives
Do you think there's more to the story for BrightView Holdings? Head over to our Community to see what others are saying!

This article by Simply Wall St is general in nature. We provide commentary based on historical data and analyst forecasts only using an unbiased methodology and our articles are not intended to be financial advice. It does not constitute a recommendation to buy or sell any stock, and does not take account of your objectives, or your financial situation. We aim to bring you long-term focused analysis driven by fundamental data. Note that our analysis may not factor in the latest price-sensitive company announcements or qualitative material. Simply Wall St has no position in any stocks mentioned.
Have feedback on this article? Concerned about the content? Get in touch with us directly. Alternatively, email editorial-team@simplywallst.com